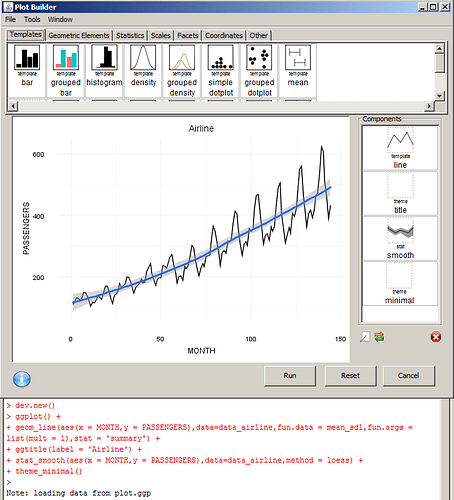
Is there a way to see the underlying ggplot code used to generate the graph?
https://exploratory.io/@1038ee6751cc/test1_549ebf56d23b/test2.npk
On the “Generated R Script” it just shows “Data Analysis Steps”, I’m also looking for “Visualization Steps” if that’s possible.
There is no ggplot involved in generating the chart. We use dplyr to generate the data and hand it over to JS/Plotly to generate the chart. We have a plan to provide a way to show you the underlying dplyr code to generate the underlying data for the chart as well. Is this something you are looking for?
2 Likes
Hi Kan,
I was looking for more like what Deducer is doing where it outputs the ggplot code and also do more customizations like facets.
Will be there be any issues w/ Exploratory on the graphing if it’s used offline (no internet connection) ?
-Karl
Other than Geo Map, you should be able to work with any chart offline. Also, Faceting is coming in one of the near releases!
1 Like
I realize this is a few months old, but I was looking for a way to generate the R code for the graph. Is this available yet? Whatever method (plotly?) is used is fine, I’m just interested in getting the code.
Thanks.
The charts in Exploratory are generated purely in Java Script, though the underlying data is generated inside R (dplyr). We have a plan to support generating the data part of R code on our roadmap.
2 Likes
I have been wondering about this as well. It makes sense now that the charts are generated using js, so there is no R script per se.
I think it would be useful to get the underlying R / dplyr script as well. One use case, which is also one of my motivation, is to be able to bring the script into Kaggle Kernels. It’s also a good place to showcase the power of Exploratory.io 


