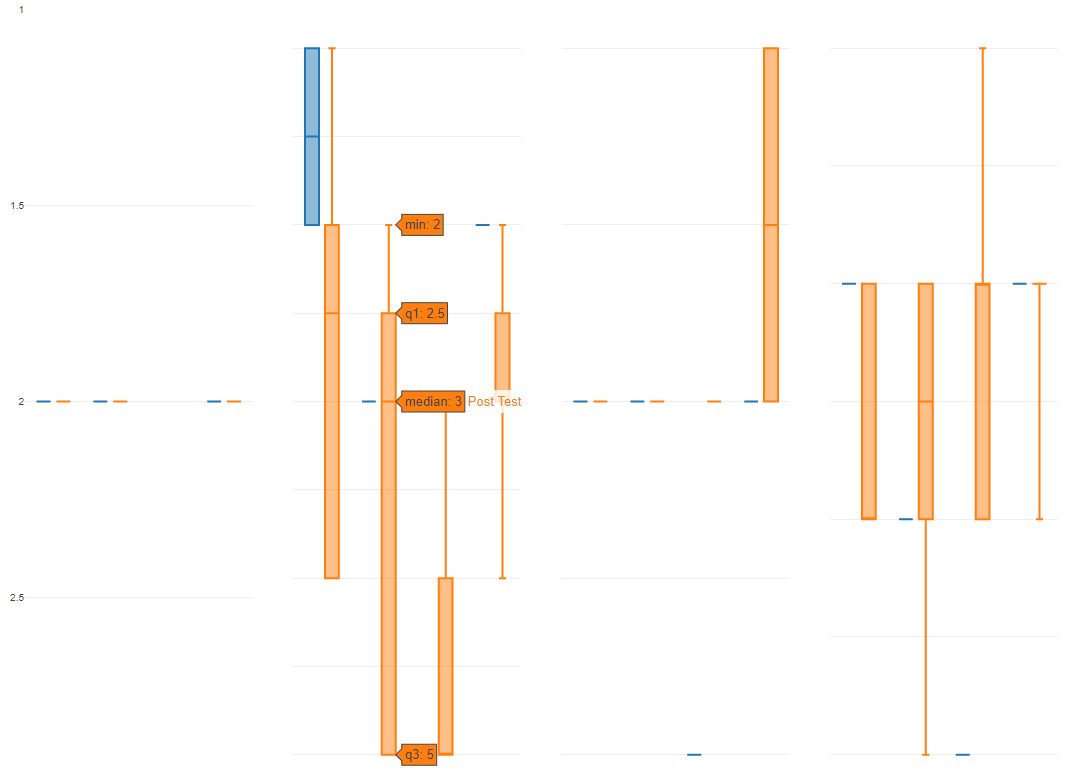
In this boxplot, I inverted the y axis. In this example, I have used “Repeat By” to result in four plots next to each other. Note how in the second plot, the boxplot actually ranges from 2-5, but the y axis ends at 3 (at the bottom). Now if I don’t invert the y axis, this plots correctly, using the largest range of y values to scale all plots so they are sync’d. But when the y axis is inverted, it seems Exploratory is not accounting for the largest y axis range. I hope this bug report helps.