The default number of columns displayed in the Summary View/Table View is 100, but you can change the number of columns displayed from the column display options located at the top right of the Table View or Summary View.
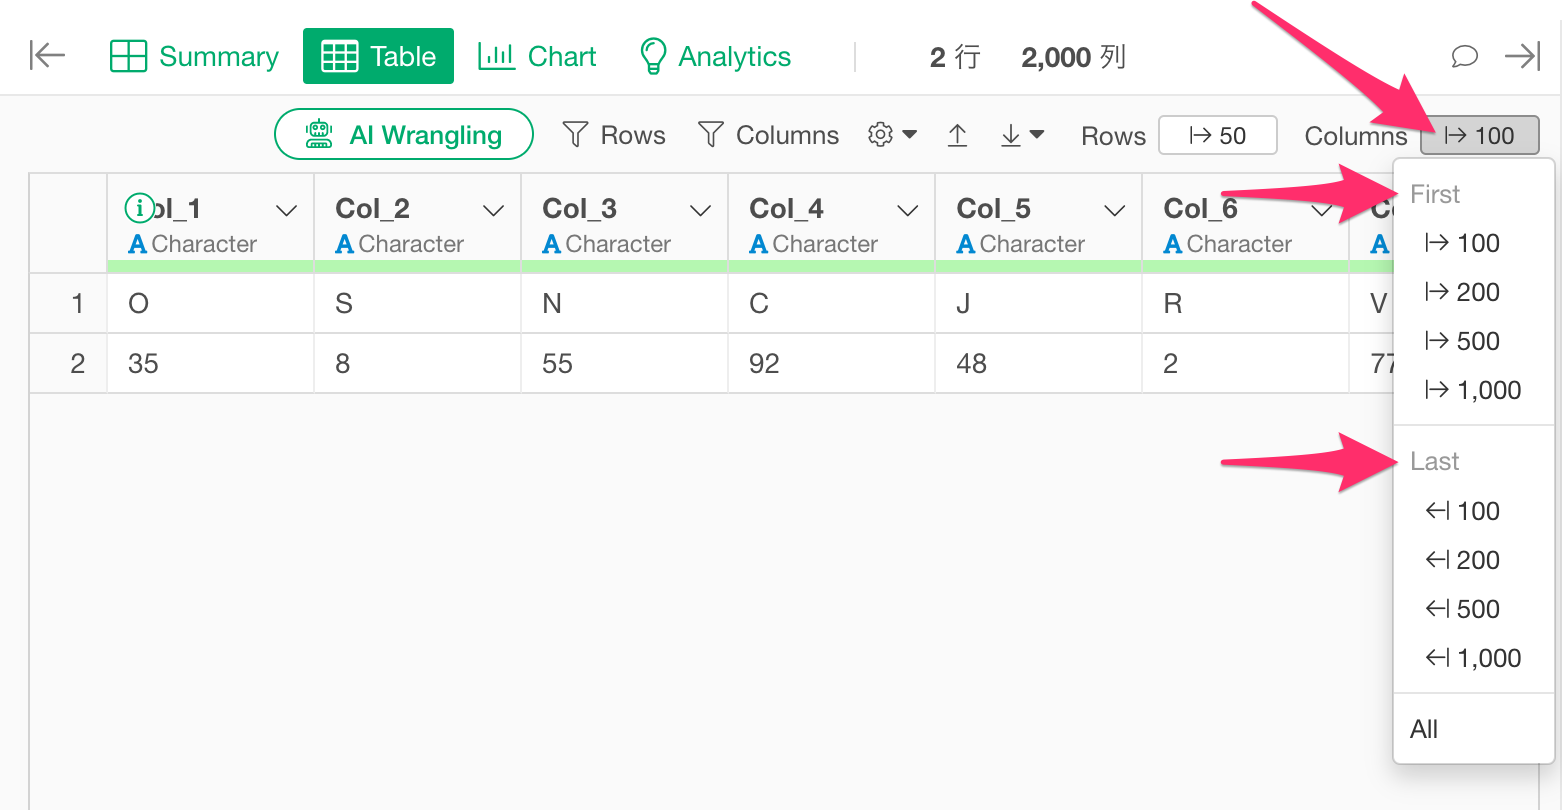
The column display options support incremental display of up to 1000 columns either from the “First” or from the “Last”.
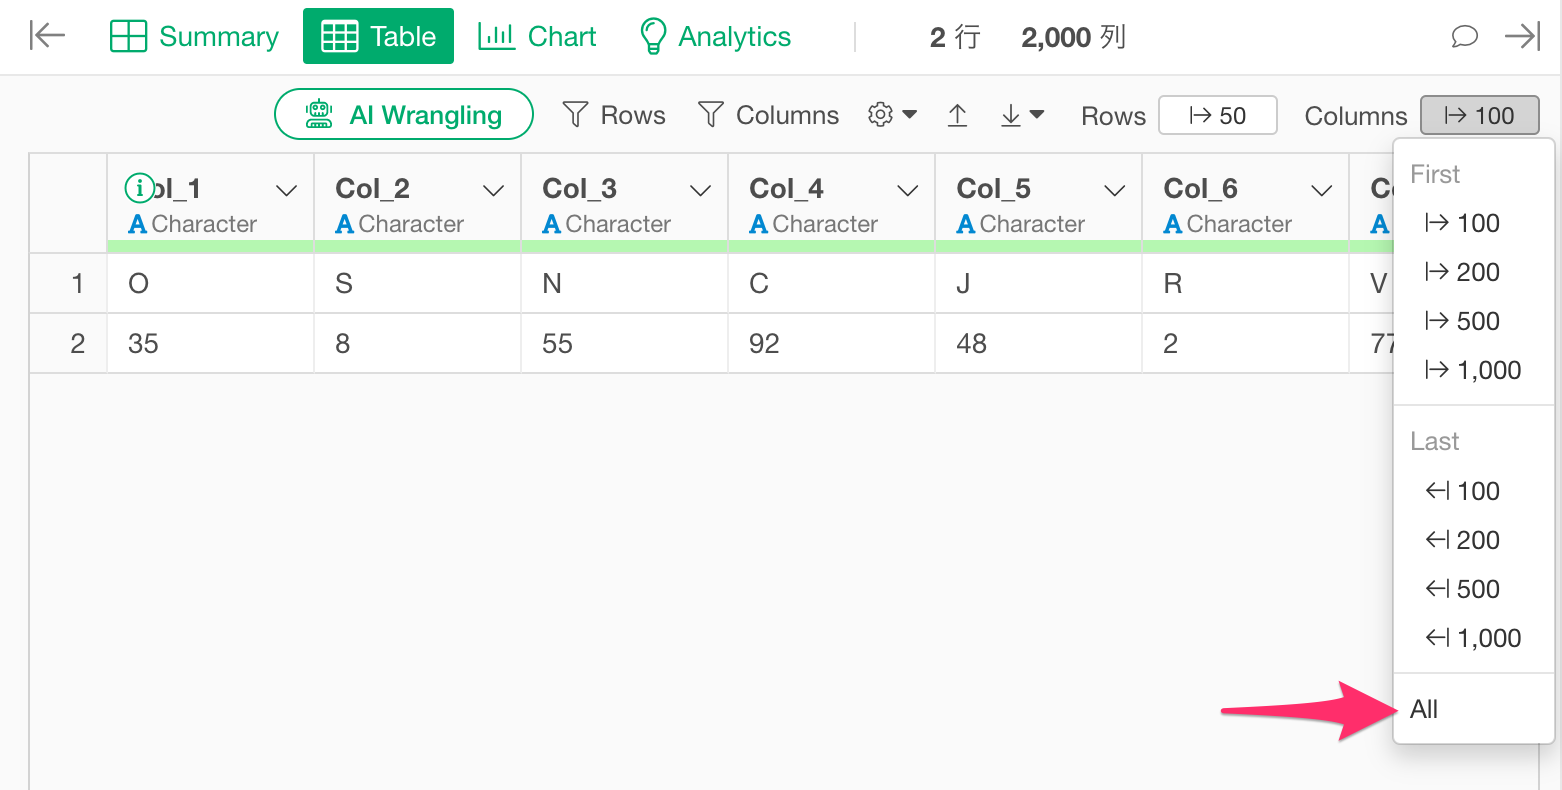
If your dataset contains more than 1000 columns, you can also choose “All” to display all columns.
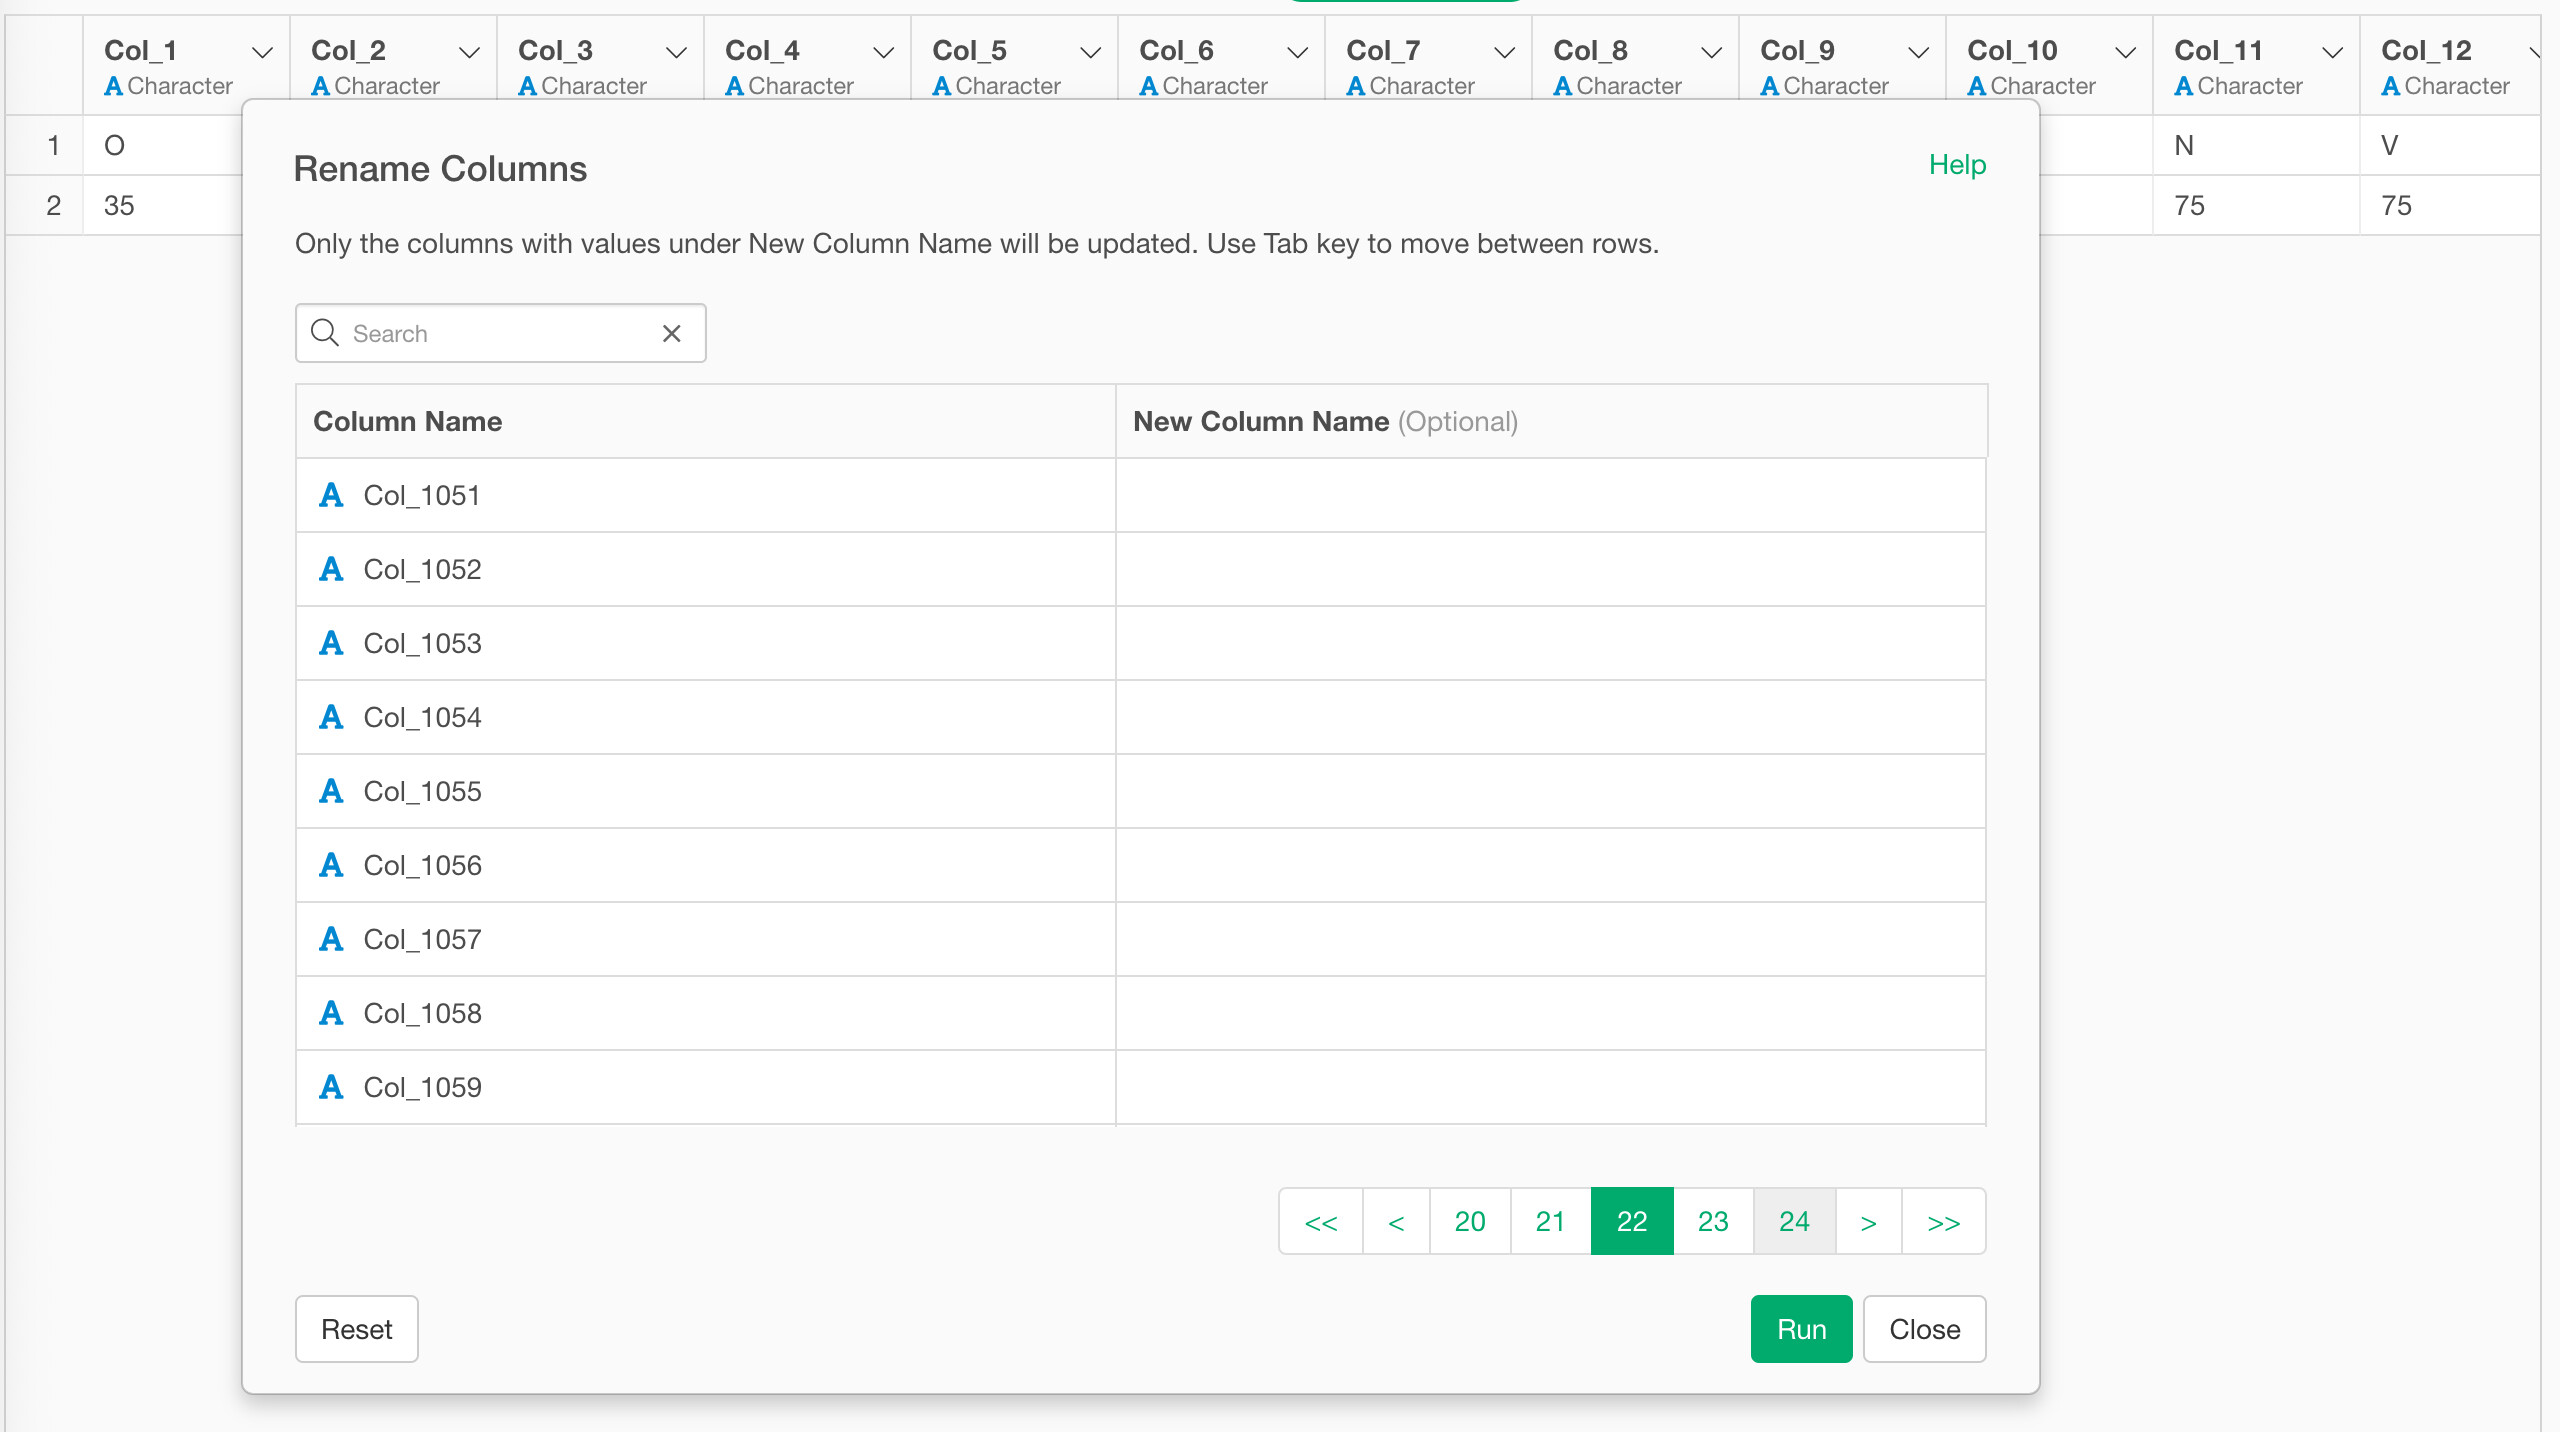
Additionally, columns that are not currently displayed are still available in the data transformation UI, and can be used for processing or as part of calculations just like the columns shown in the Summary or Table View