Hi guys,
I love using Exploratory because it allows me to quickly do tasks that I can’t do in R, and I would much appreciate you checking this issue.
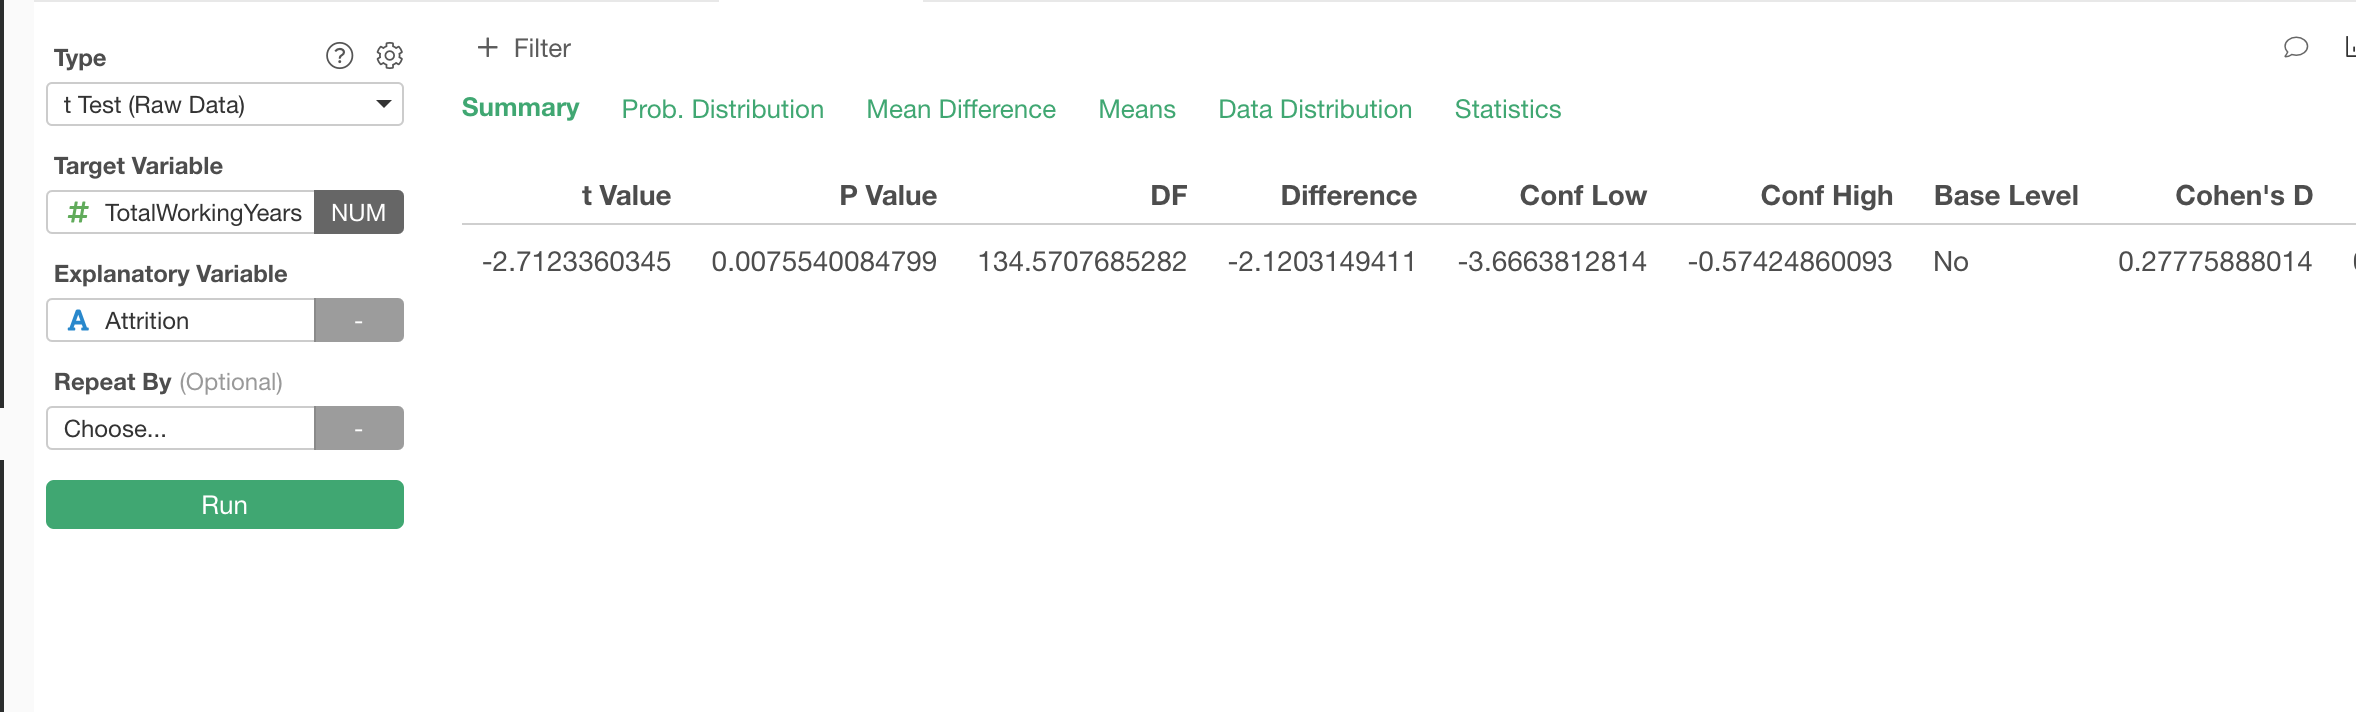
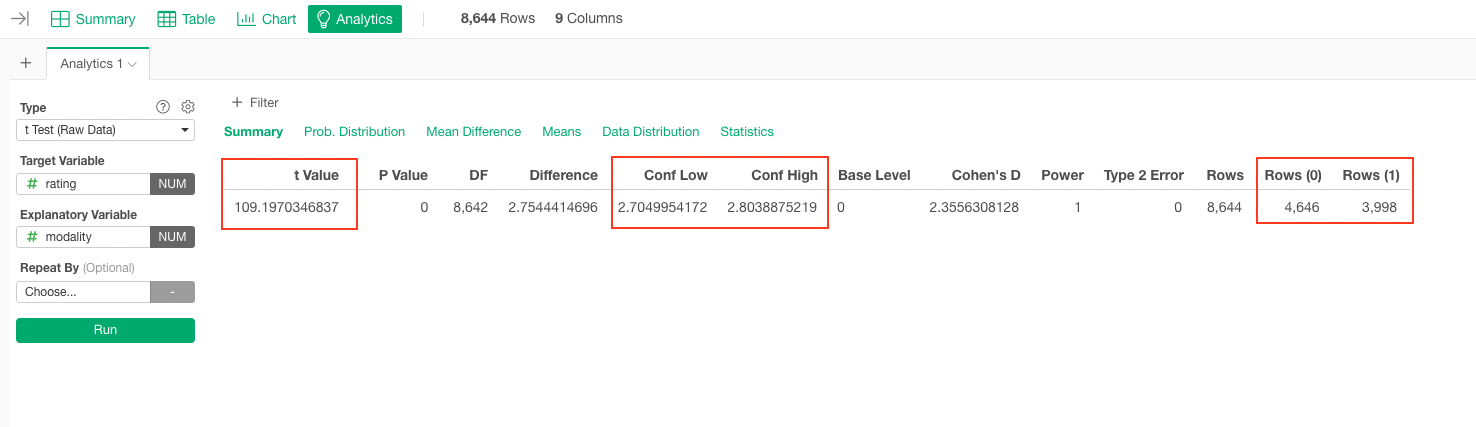
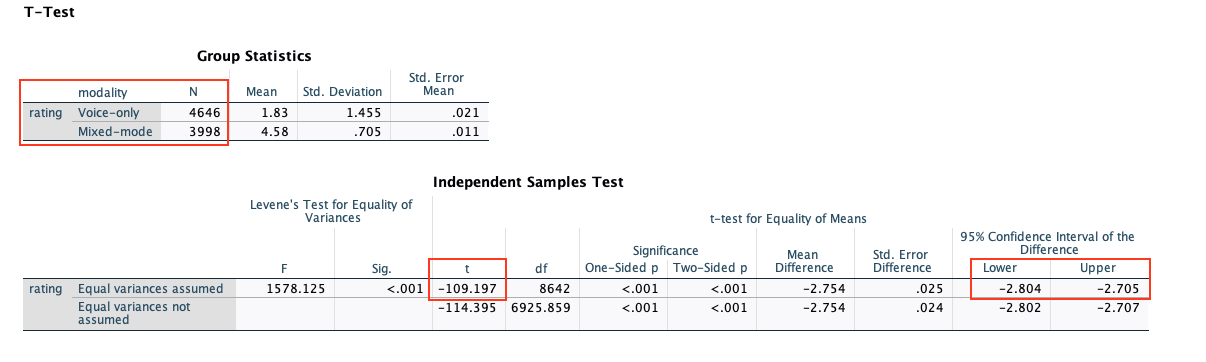
I seems like some of the Summary values in the ‘t Test (Raw data)’ analytics are being presented incorrectly. I have compared the T test results from SPSS and R (from two different datasets) with Exploratory, and found the t-value and 95% confidence interval (CI) results are reversed.
For example, the t-value is negative when it should be positive, the higher bound CI is displayed as “Conf Low”, and the lower bound is displayed as “Conf High”.
Please check this feature when you can.
Thanks,
Emmanuel