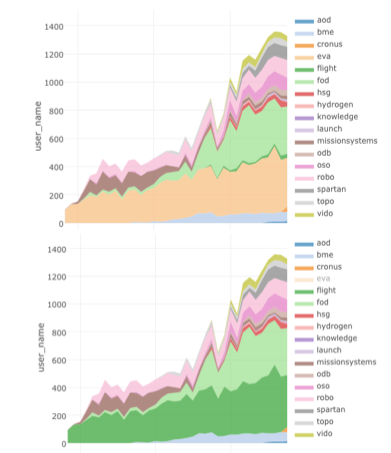
Here are two versions of a plot. The first has all groups displayed. The second has “eva” de-selected".

This is misrepresenting the data. The remaining groups of data should “shrink down” to represent the new cumulative total value of the stacked area without “eva”.
