Hi, I am working with a large time-series data set, which is organized by site and day. I have daily temperatures and I want to calculate a consecutive 7 day moving average of these data in a way that recognizes gaps in dates (return NA) and shifts to new sites (should restart calculation). I want the function to return NA values anytime there are data gaps in the 7-day timespan.
It seems like the roll_mean function should work but it doesn’t account for data gaps and shifts in group (sites). Any help is greatly appreciated. I am new to Exploratory and rusty with my R coding skills.
There are lots of time-consuming ways to force this and I have done it manually for years in Excel, but I just know that there should be a smarter way to approach this task and I have LOTS of data to run this through.
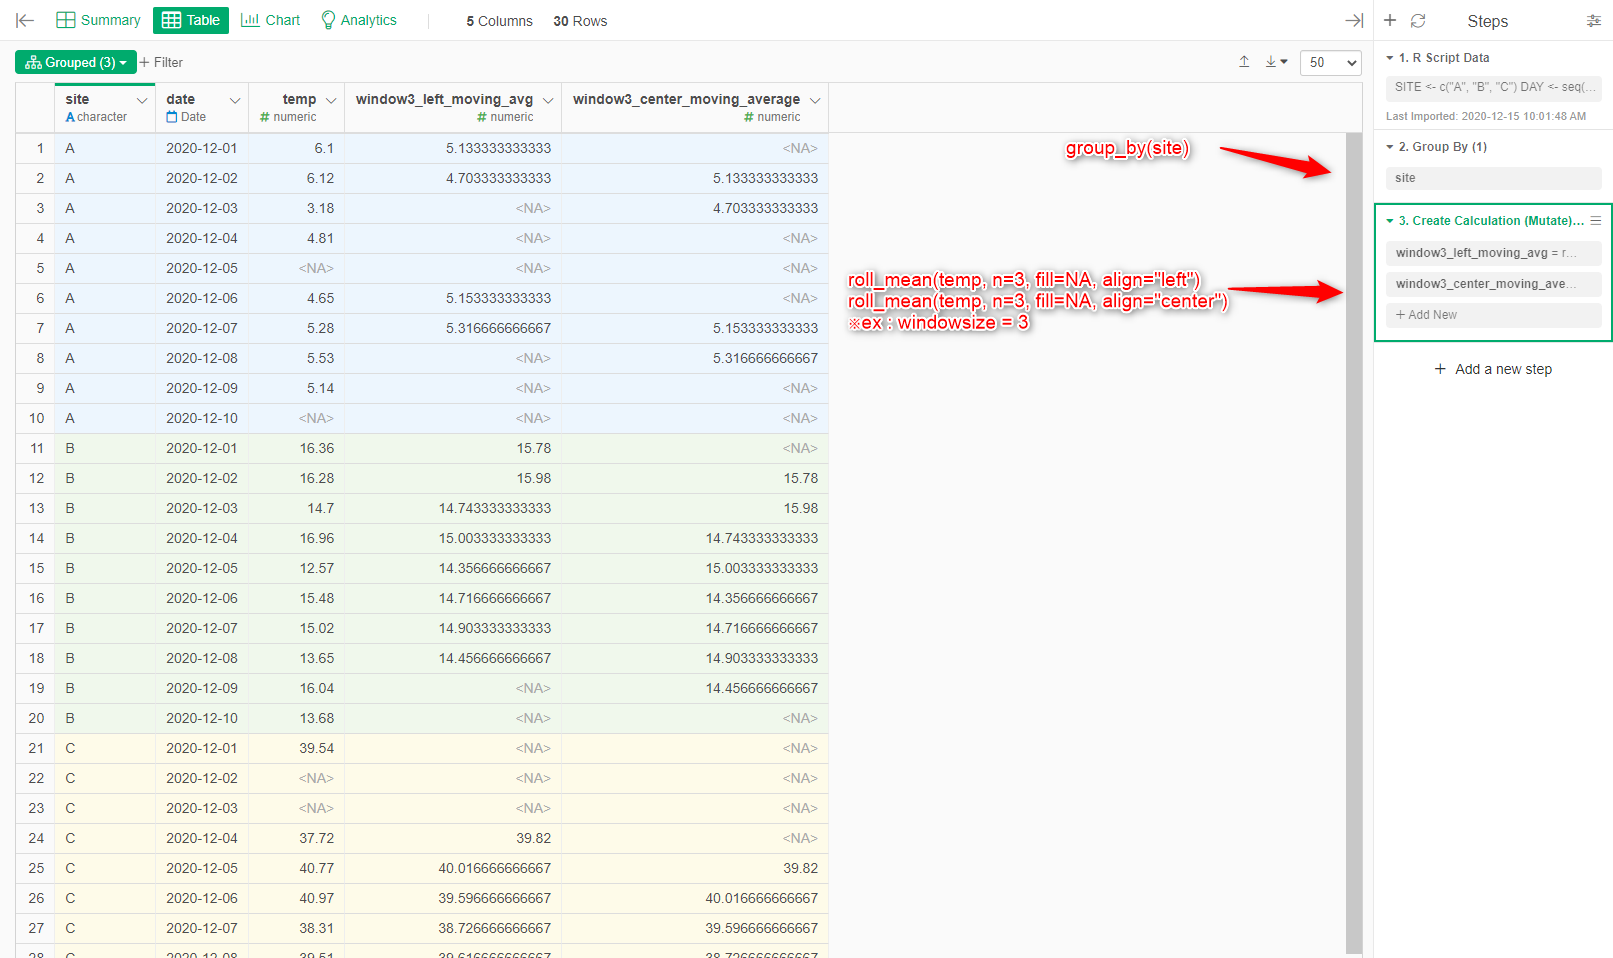
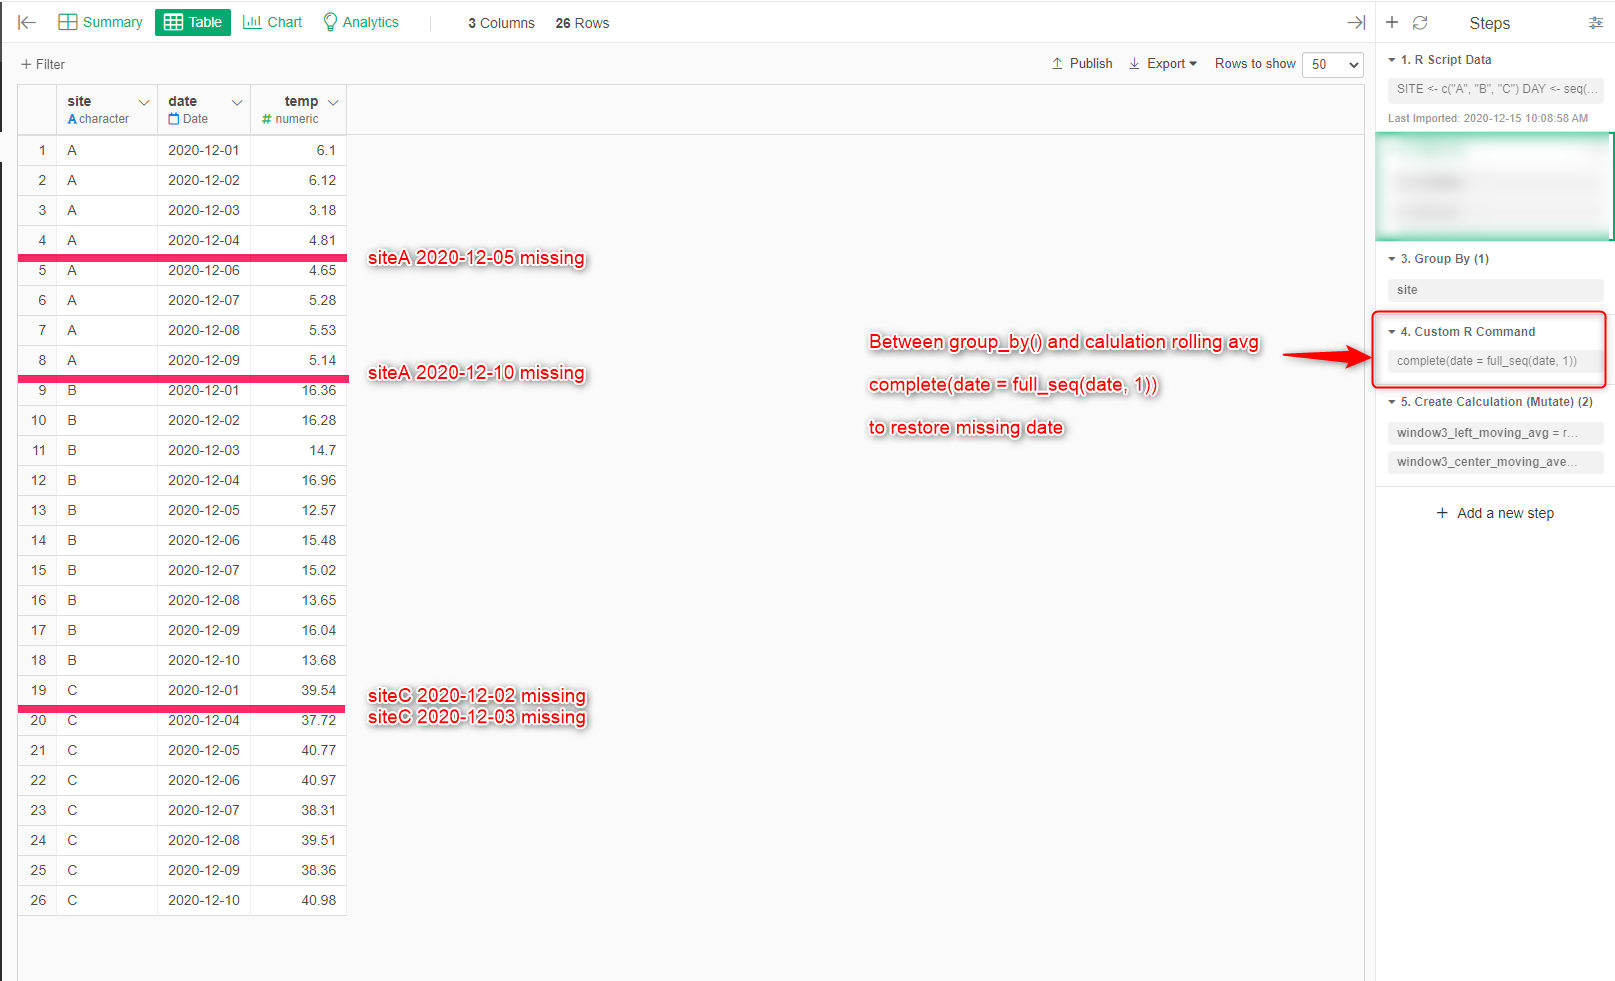
Is it a problem that cannot be dealt with by the combination of group_by(site) and roll_mean(fill=NA)?
recognizes gaps in dates (return NA)
shifts to new sites (should restart calculation)
※It may not be useful because I do not understand the relationship between the above part of the question content and the table structure (date, temp, site) accurately.
in the Rscript dataframe, sample data was generated by as follows.
N <- 10
SITE <- c("A", "B", "C")
DAY <- seq(as.Date("2020-12-01"), as.Date("2020-12-10"), by = "day")
MU <- c(5, 15, 40)

set.seed(1989)
df <- data.frame(
  site = rep(SITE, each = N),
  date = rep(DAY,  times = length(SITE)),
  temp = unlist(purrr::map(.x = MU, .f = function(x){round(rnorm(n = N, mean = x),2)}))
)

df[5,3] <- NA
df[10,3] <- NA
df[22:23,3] <- NA
df