Here is how to show the values directly on the plot area of PCA Biplot chart.
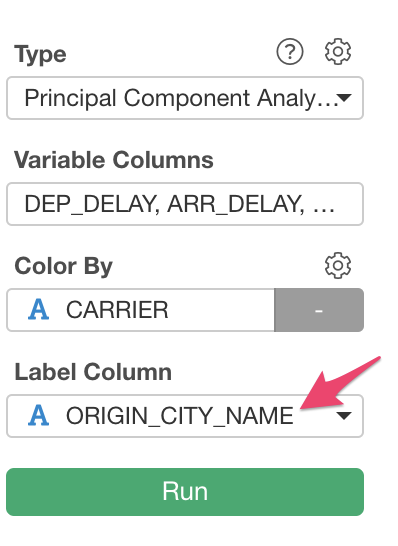
- Set a column that has values you want to show at Label Column.
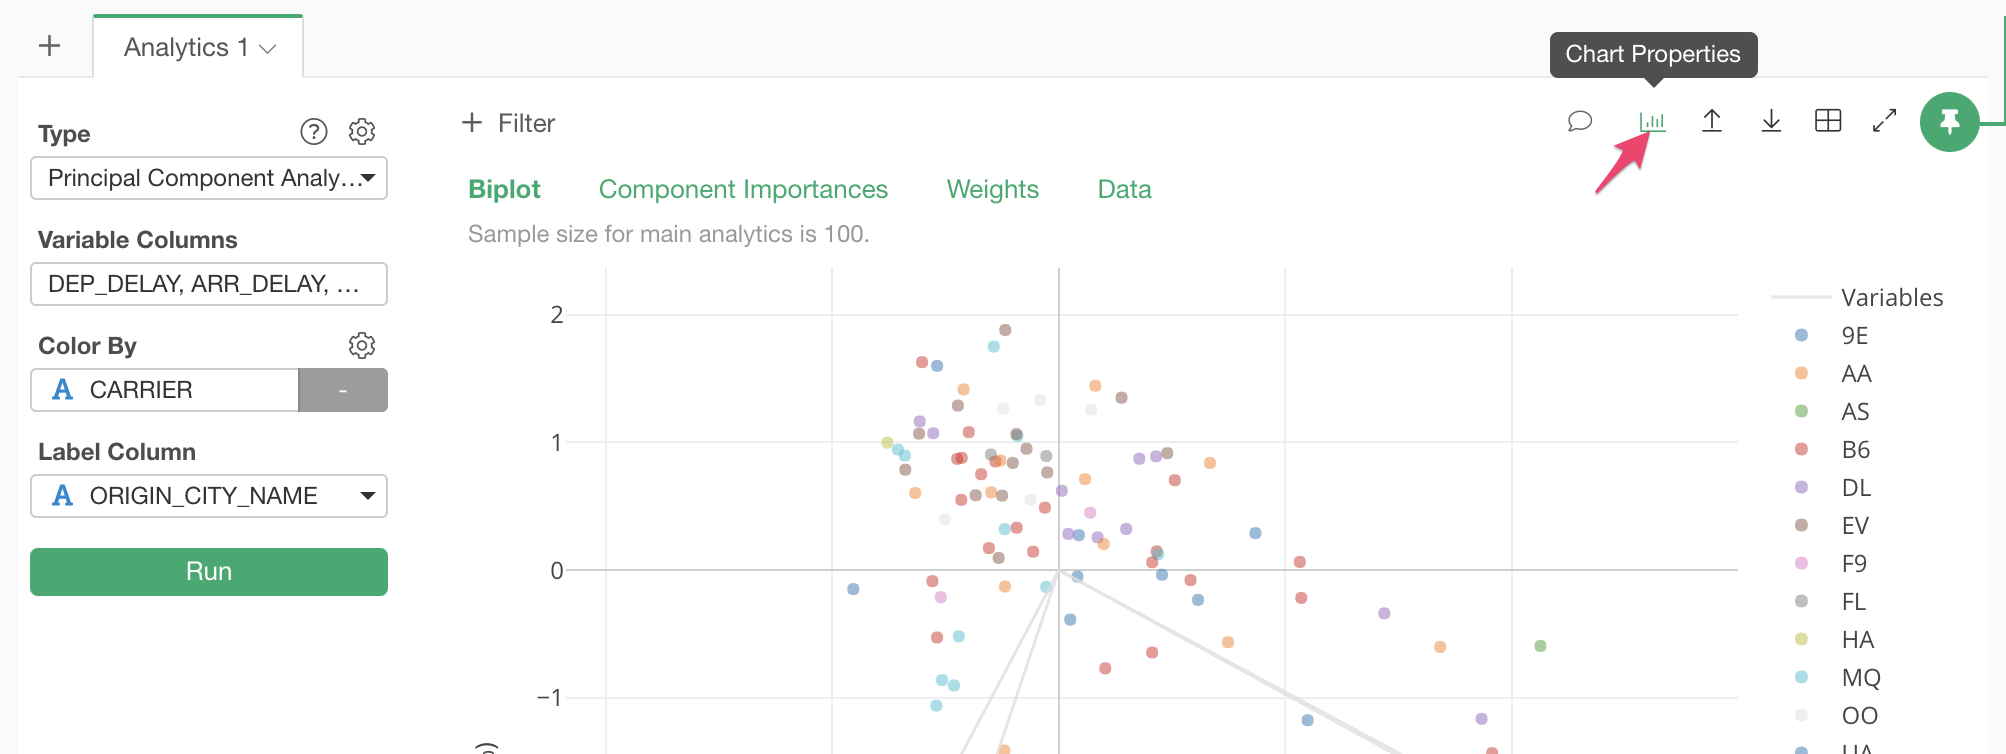
- Click the Chart Properties icon to open the chart property dialog.
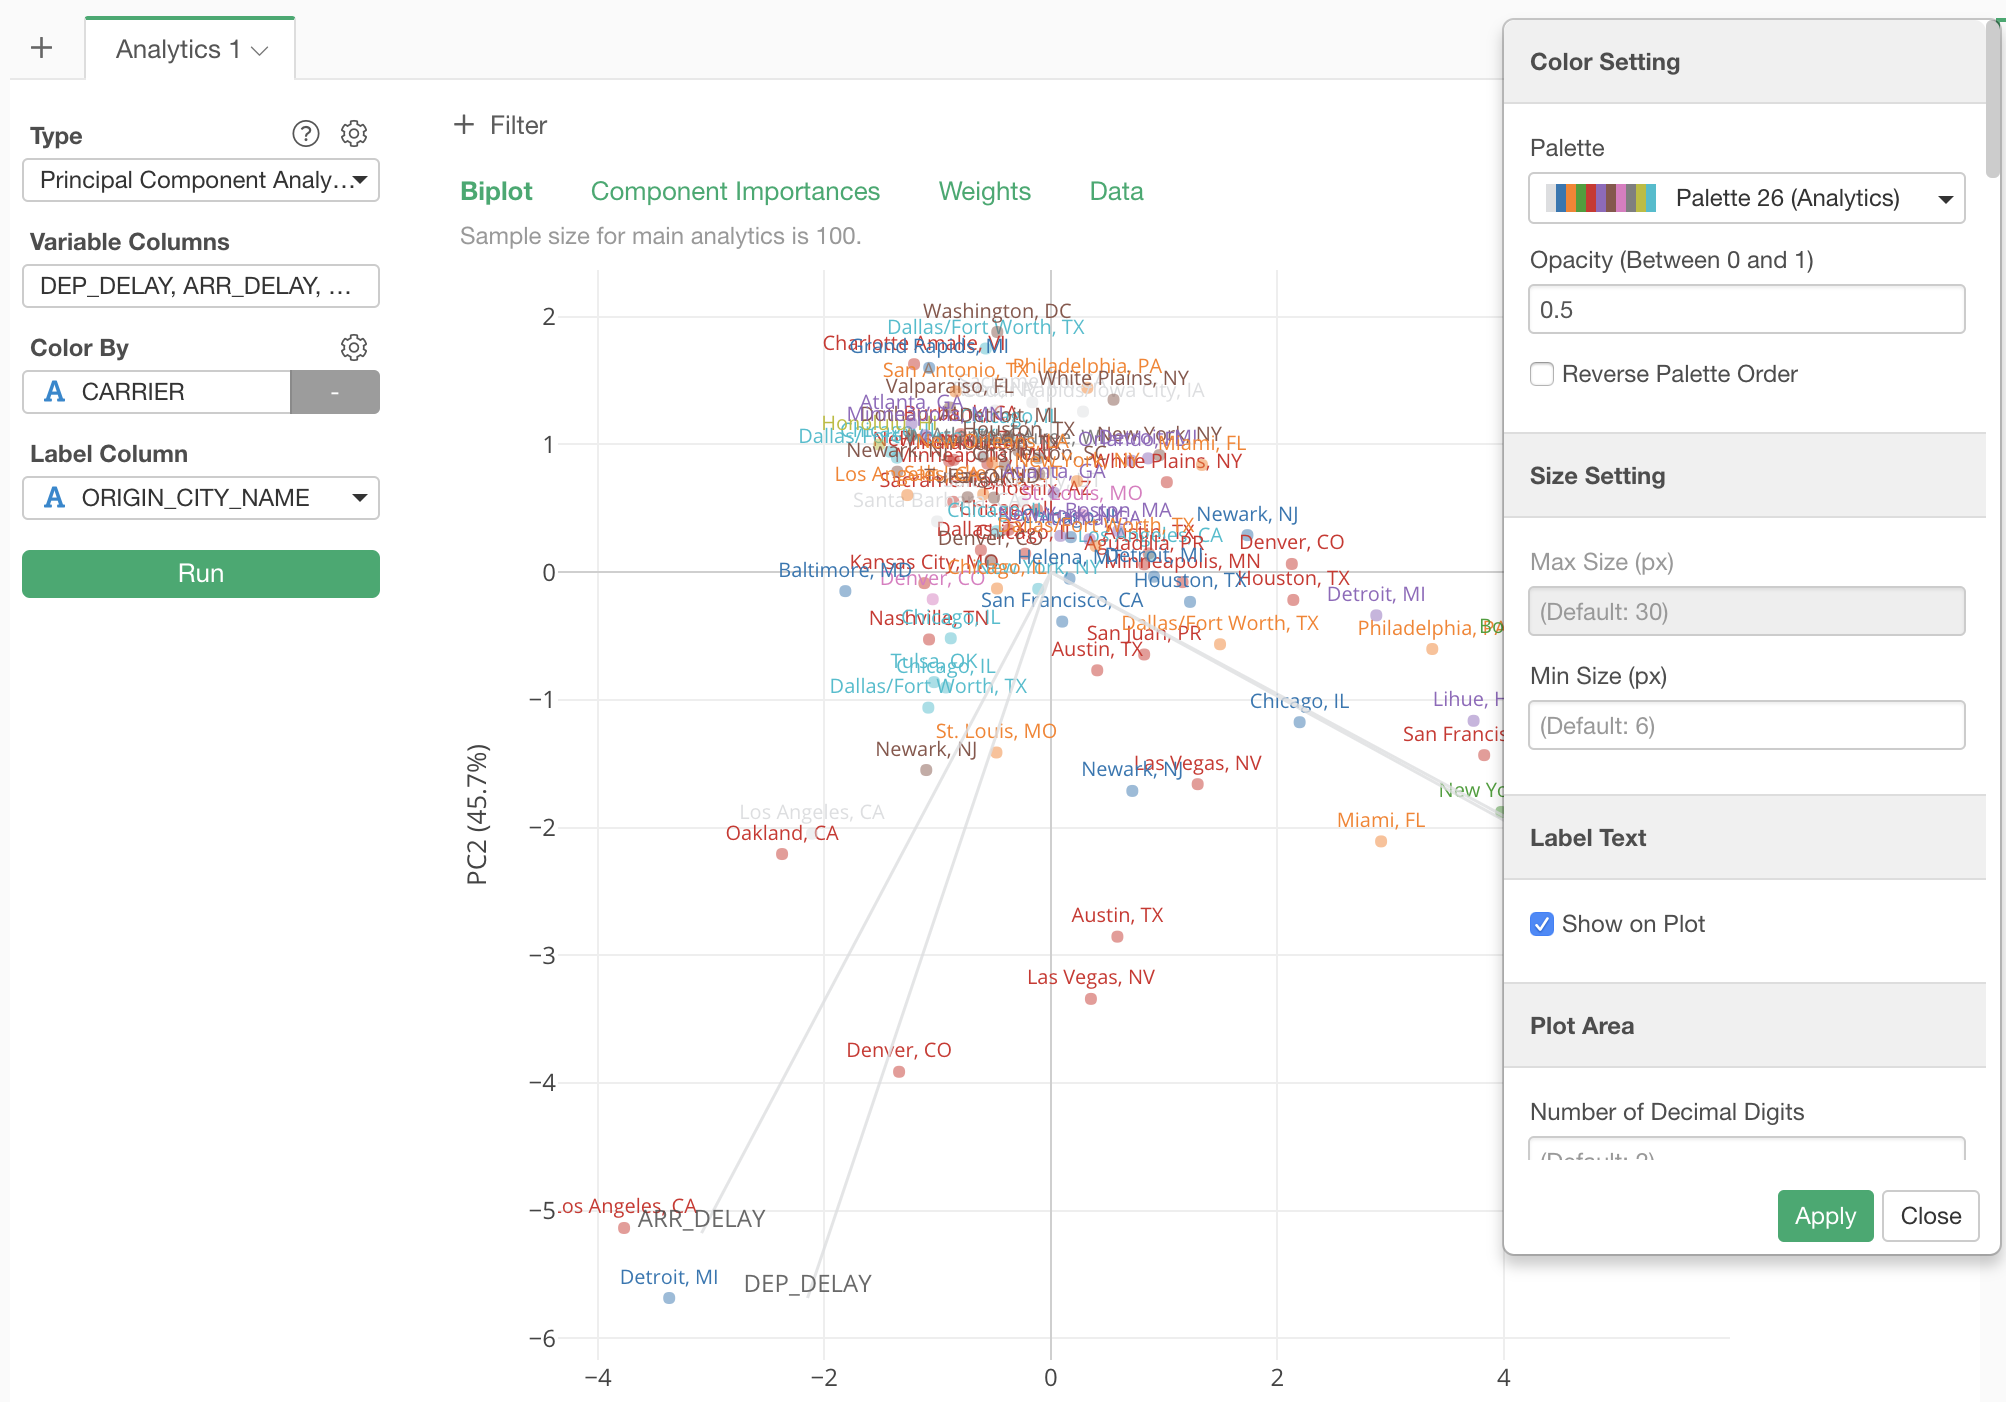
- Check Show on Plot at Label Text section and click Apply button. Then you will see values on the plot area.
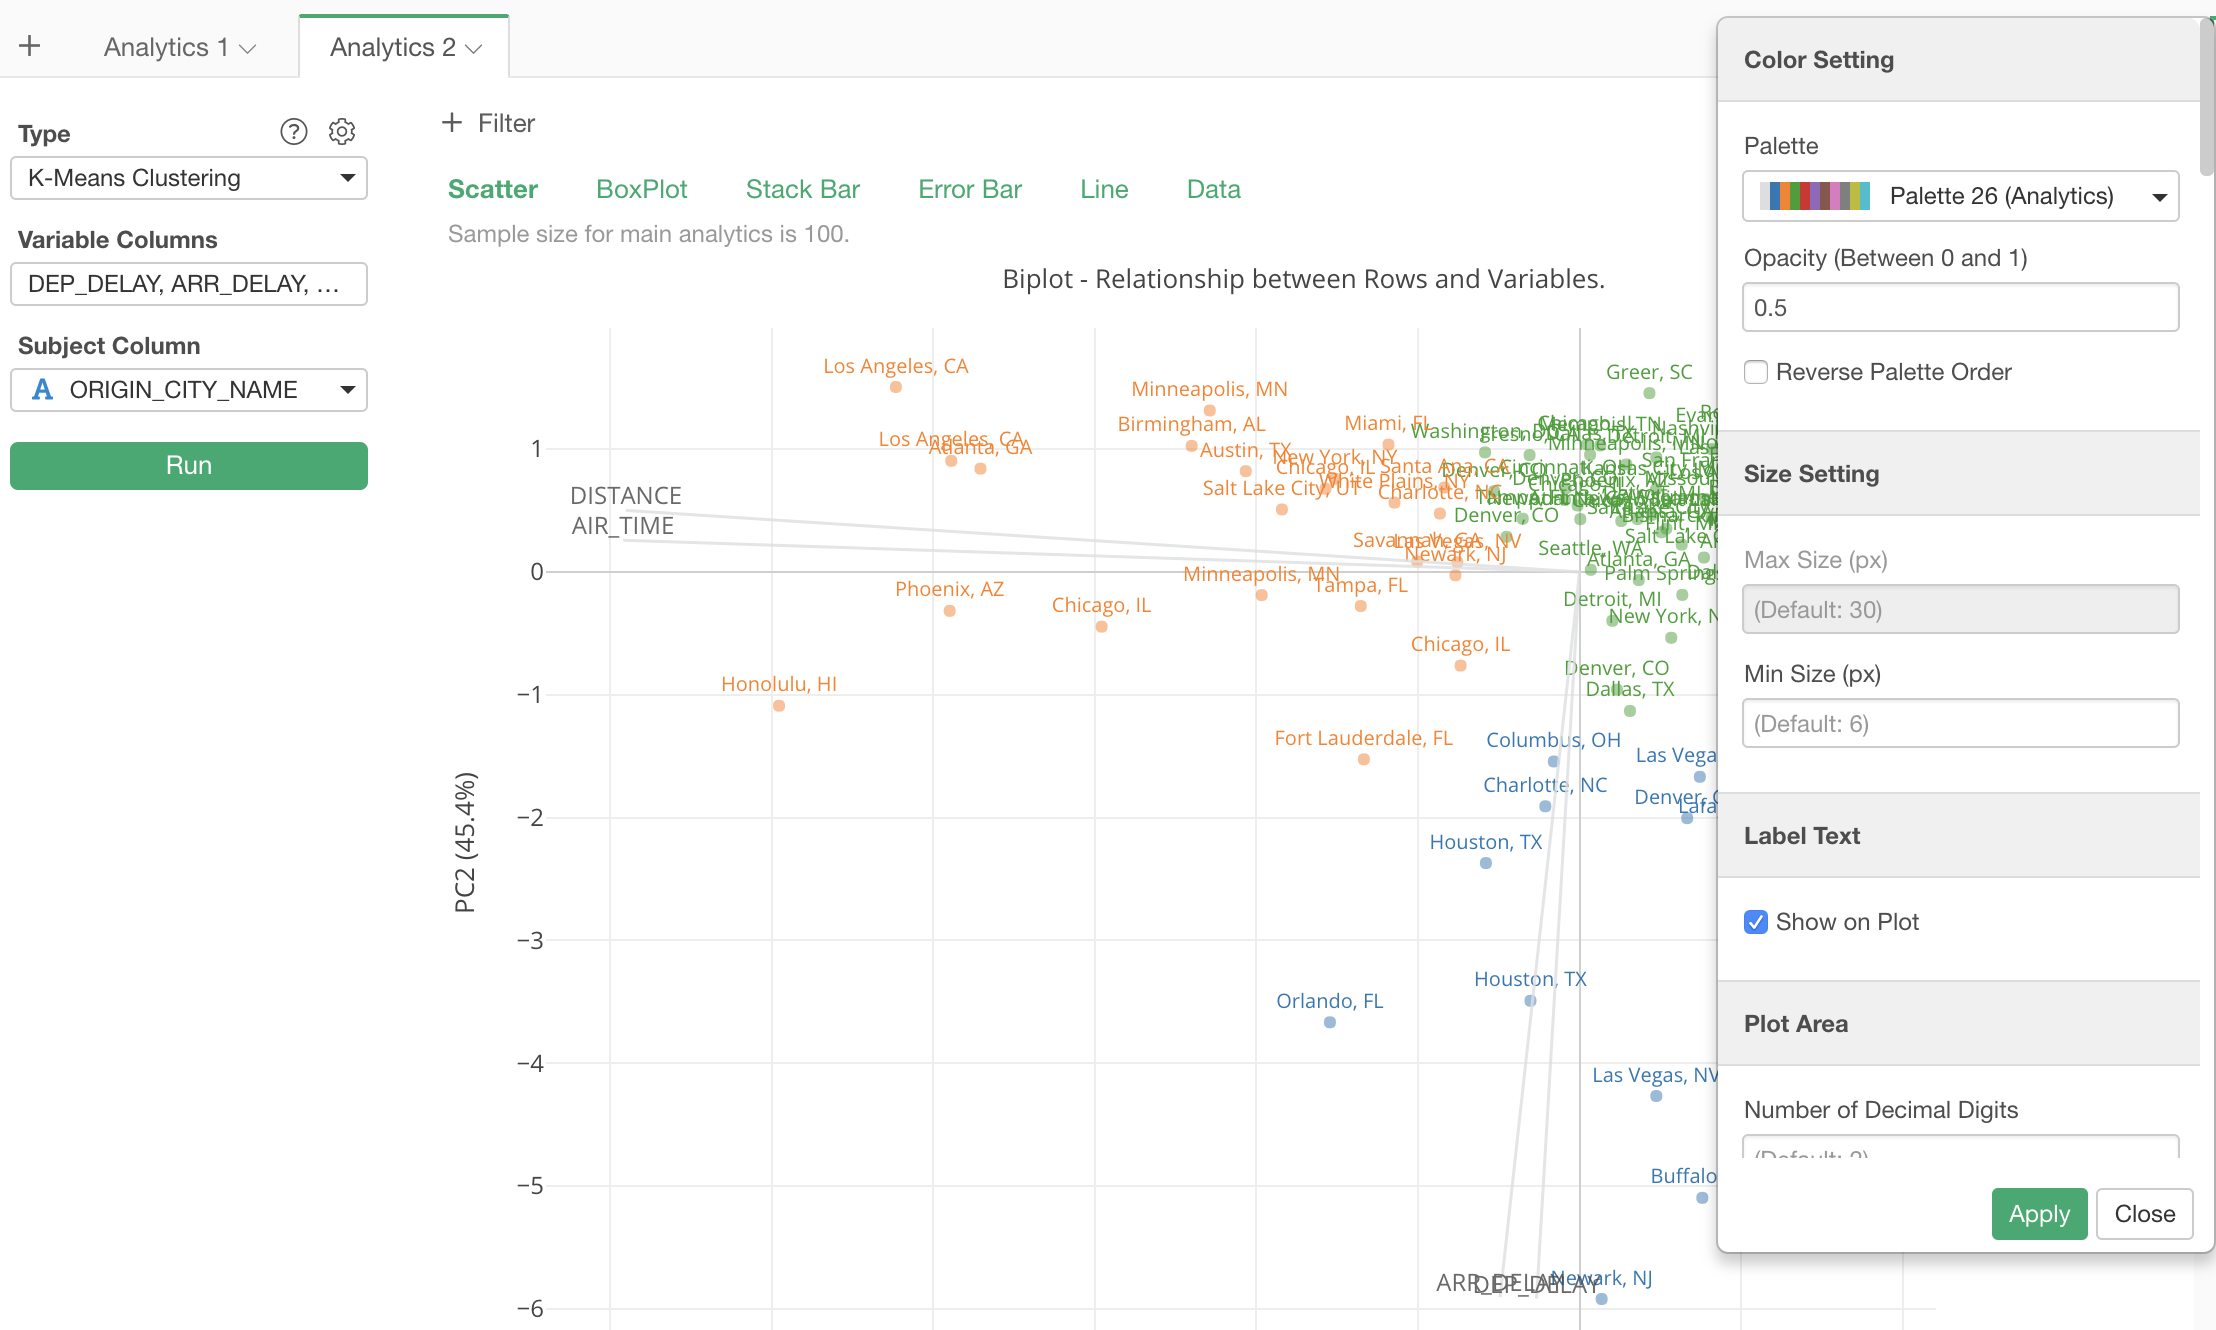
You can do the same thing on the Scatter plot in K-Means clustering.