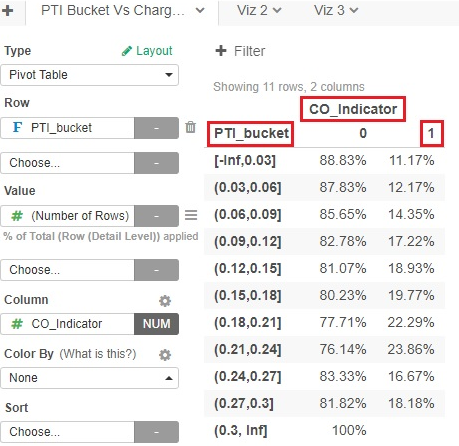
Is there a way to make a separate table showing only “PTI bucket” and “CO_Indicator” rate under column header : “1”.
Motive: Plot the resultant two variables using a line graph.
Is there a way to make a separate table showing only “PTI bucket” and “CO_Indicator” rate under column header : “1”.
Motive: Plot the resultant two variables using a line graph.
Looks you can use ‘Filter’ (above the chart there) and filter to keep only ‘1’ for CO_indicator column.