Hello! I’m using PCA on my data (45 columns, 63084 rows) and I noticed in the data section there are only 1000 rows. I tried changing the sample size in the PCA settings to be equivalent to the number of rows but it doesn’t change the number of rows listed in the data section of the PCA. I’m a little confused if this means it’s only working on 1000 random rows? I’m very new to PCA so I can’t tell if it’s functioning as it should :(. I even tried it with only 3 variables to see if there would be a difference but still no luck so I’m guessing it’s not supposed to give me more than 1000 rows? Also, I want to use the components from PCA to do a linear regression but I’m not sure how to do that in Exploratory?
Postscript
I did not know that it is possible to export unsampled data, as explained in the post below. So, the script is unnecessary. Sorry about that.
hi @Natasha_Lee
As you said, when I run PCA from the “analytics view”, it is sampled. Probably the larger the sample size, the longer it will take to visualize, so it will be sampled. It is also possible to import the principal component scores as a new data frame from the “Analytics view”, but it seems to be sampled in this case as well.
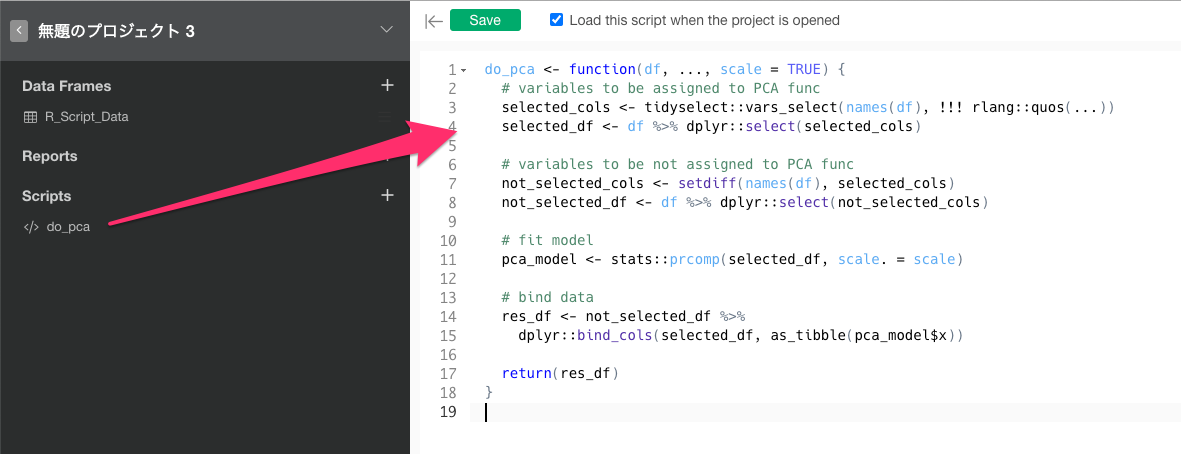
Therefore, I think we need to register a “R script” that can run PCA from the “step” and return the principal component scores. This is a rough R script…sorry I will post it for your reference.
by using this script, you can run the PCA from the “step” and then use the principal component scores to build a linear regression model. I apologize if I did not properly understand the intent of your question…I hope this helps.
do_pca <- function(df, ..., scale = TRUE) {
  # variables to be assigned to PCA func
  selected_cols <- tidyselect::vars_select(names(df), !!! rlang::quos(...))
  selected_df <- df %>% dplyr::select(selected_cols)

  # variables to be not assigned to PCA func
  not_selected_cols <- setdiff(names(df), selected_cols)
  not_selected_df <- df %>% dplyr::select(not_selected_cols)

  # fit model
  pca_model <- stats::prcomp(selected_df, scale. = scale)

  # bind data
  res_df <- not_selected_df %>%
    dplyr::bind_cols(selected_df, as_tibble(pca_model$x))

  return(res_df)
}
Sample Analysis Example
1. Save R script
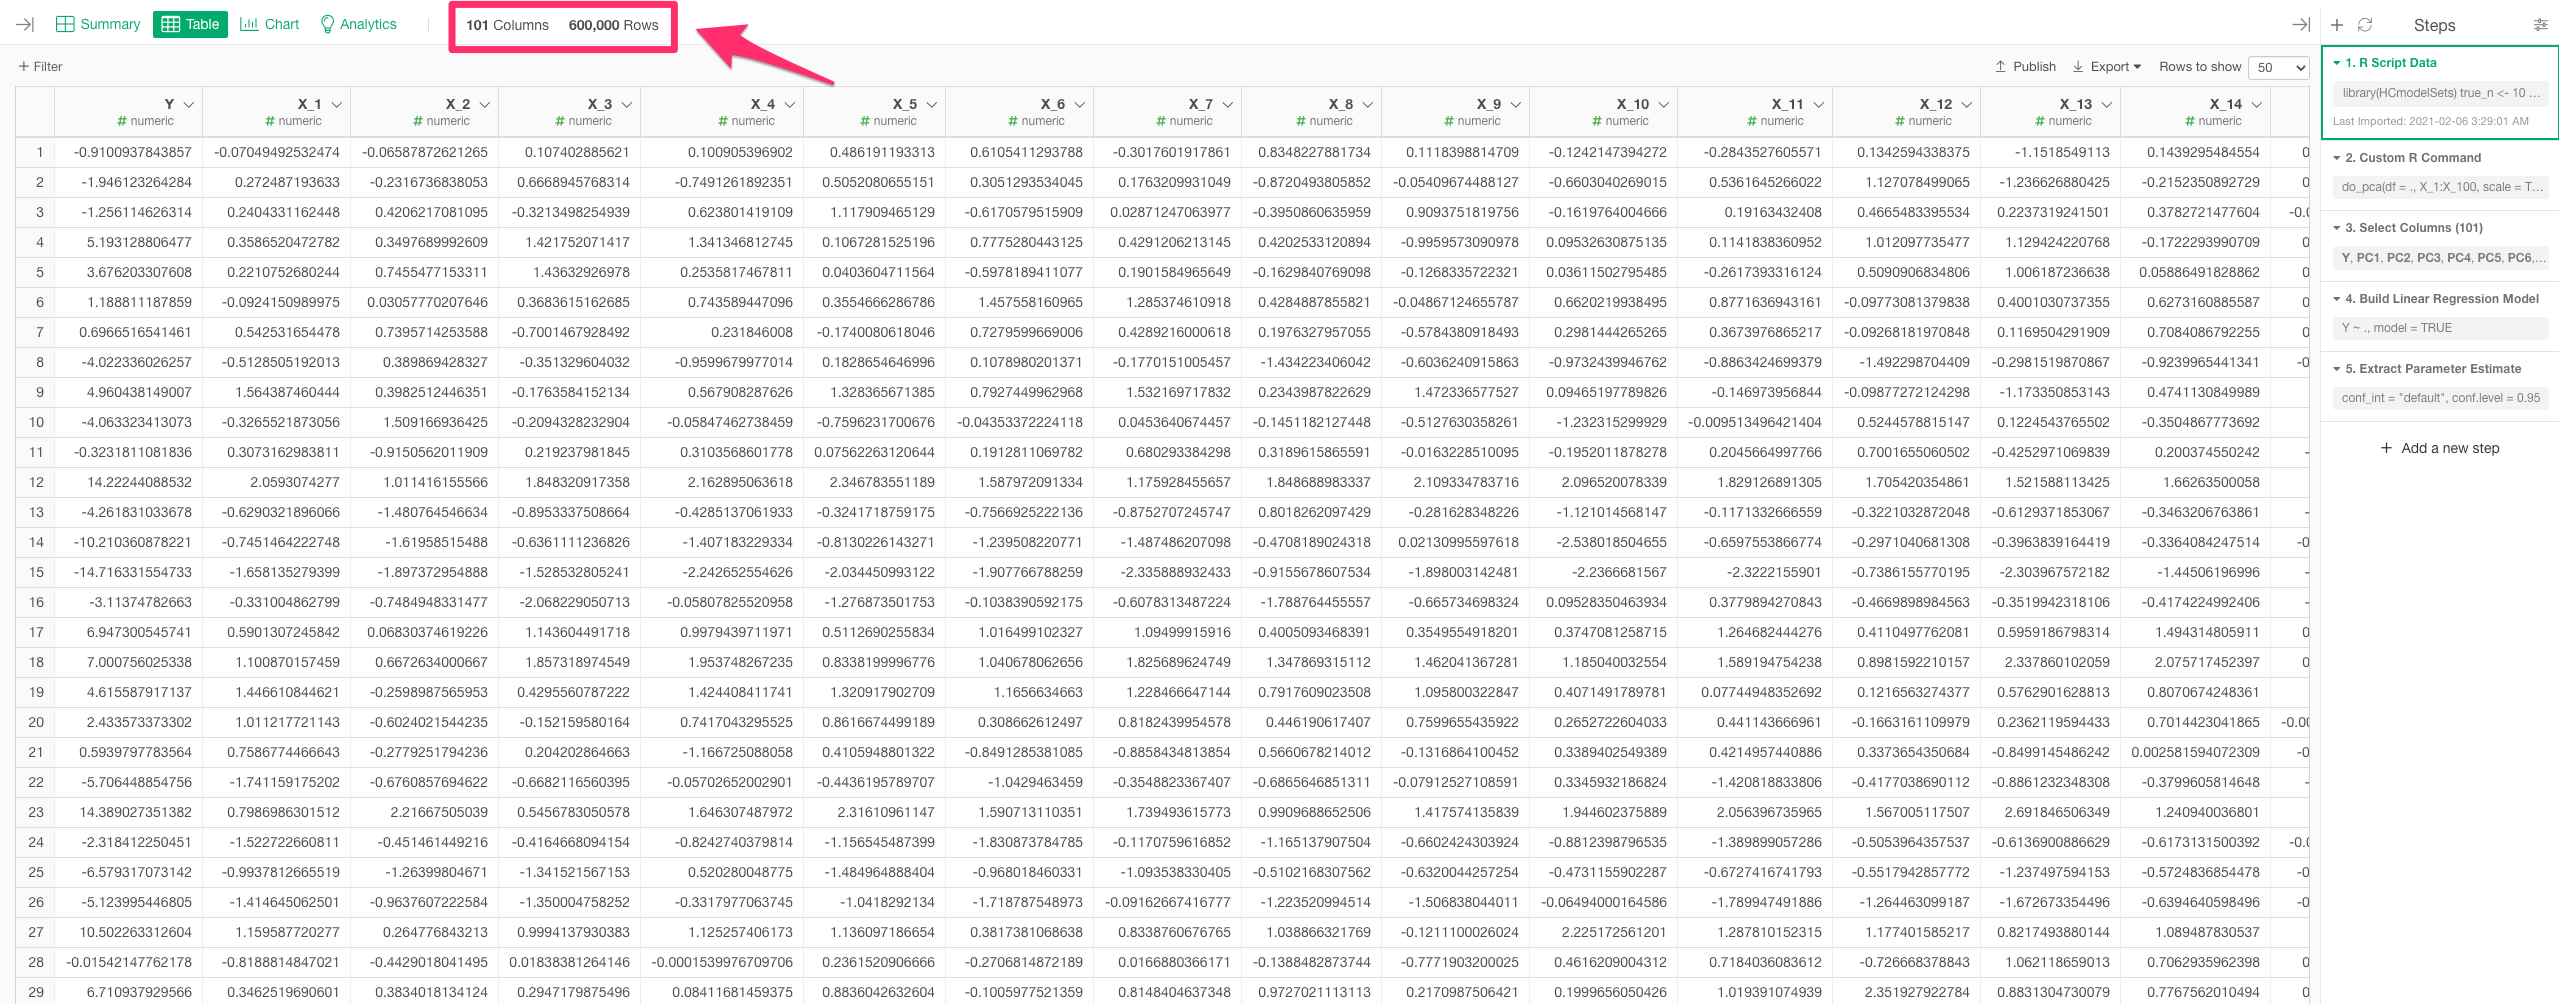
2. prepare sample data
sample data is 101 cols & 600,000 rows. data has Y col & X1~X100 cols.
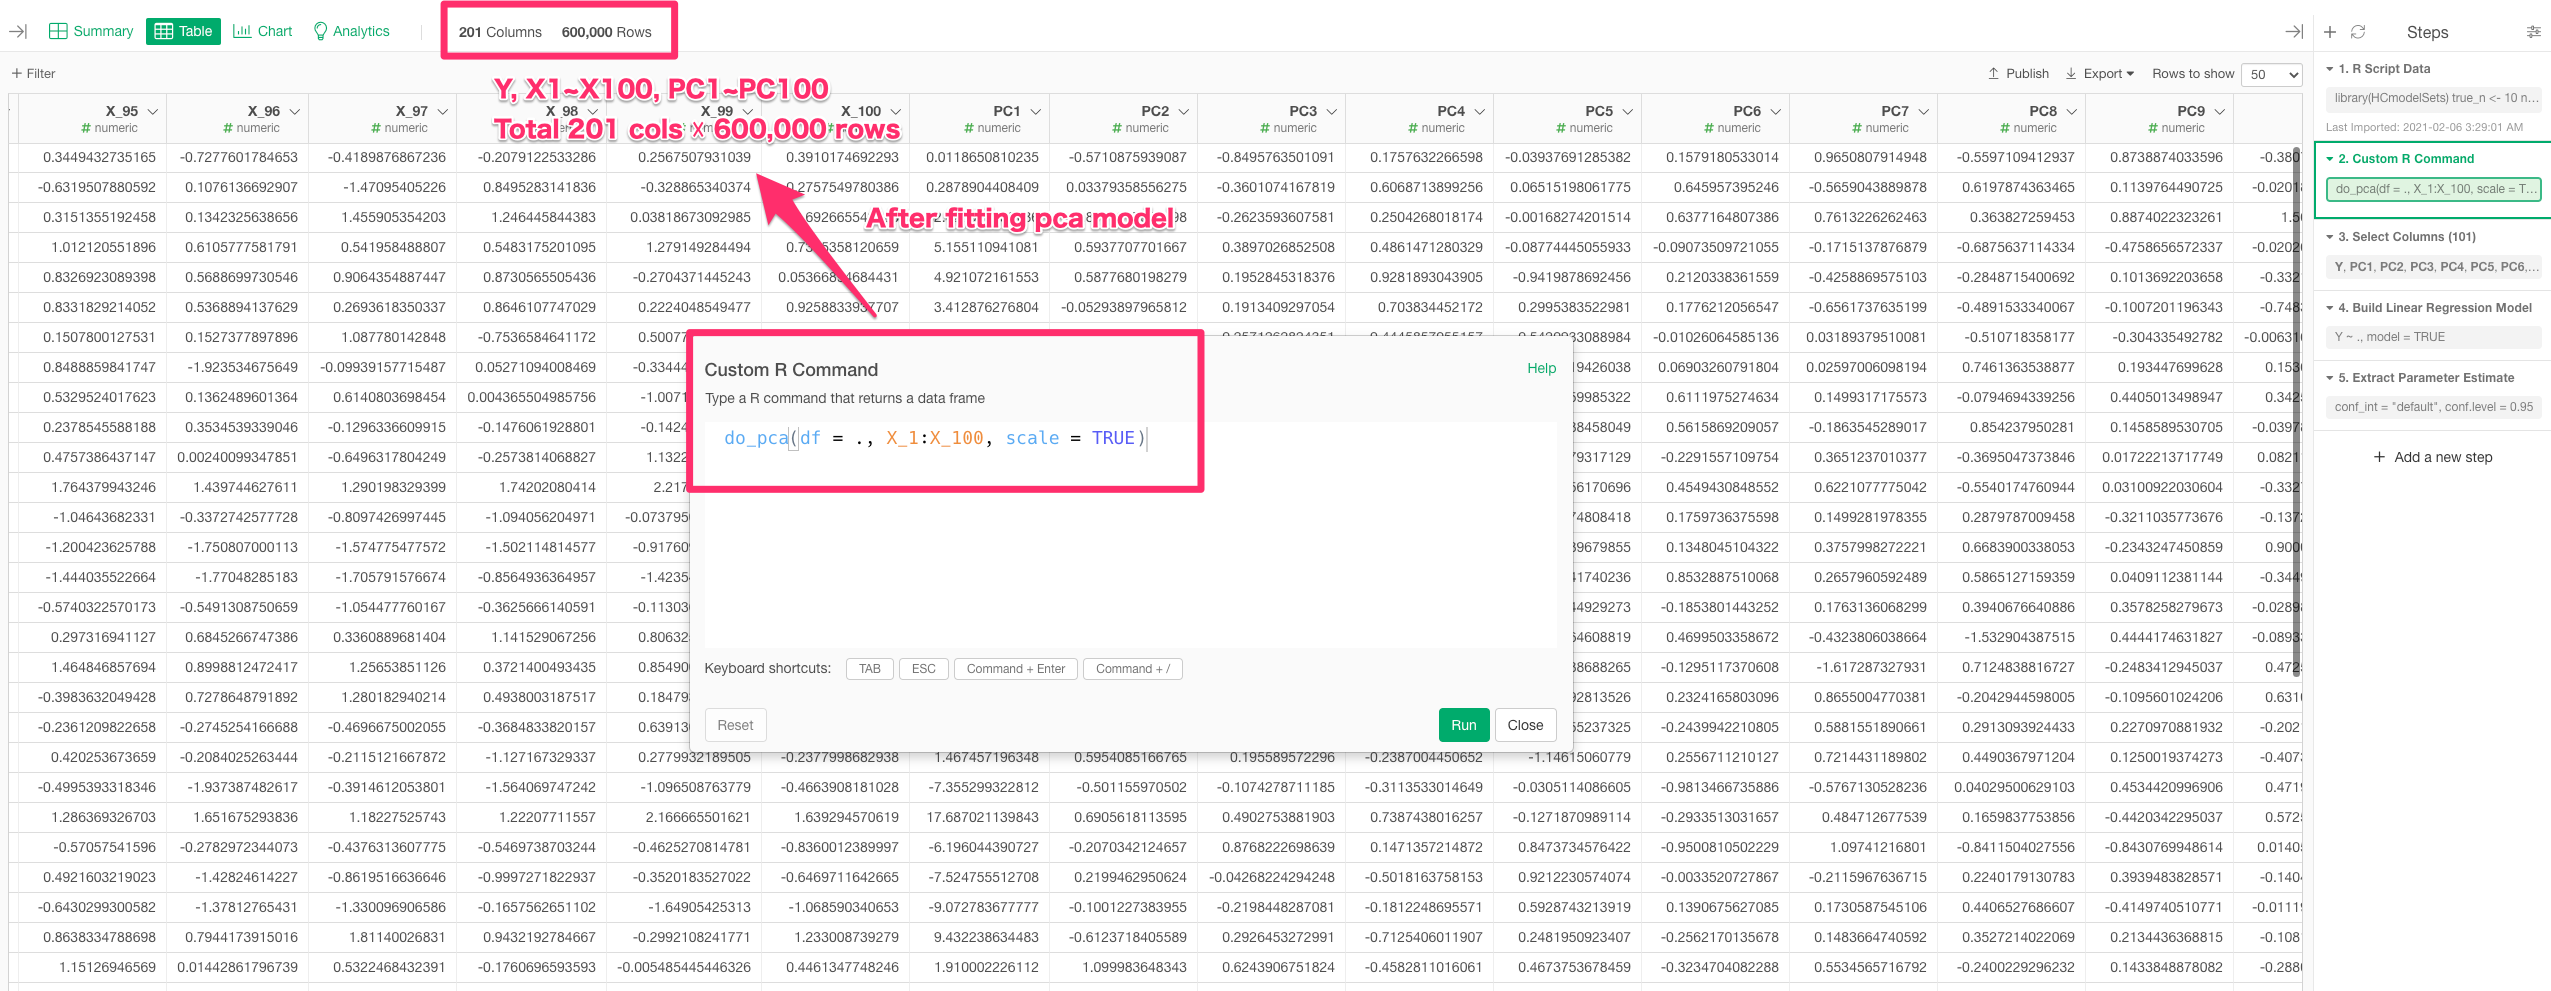
3. do pca
do_pca(df = ., X_1:X_100, scale = TRUE)
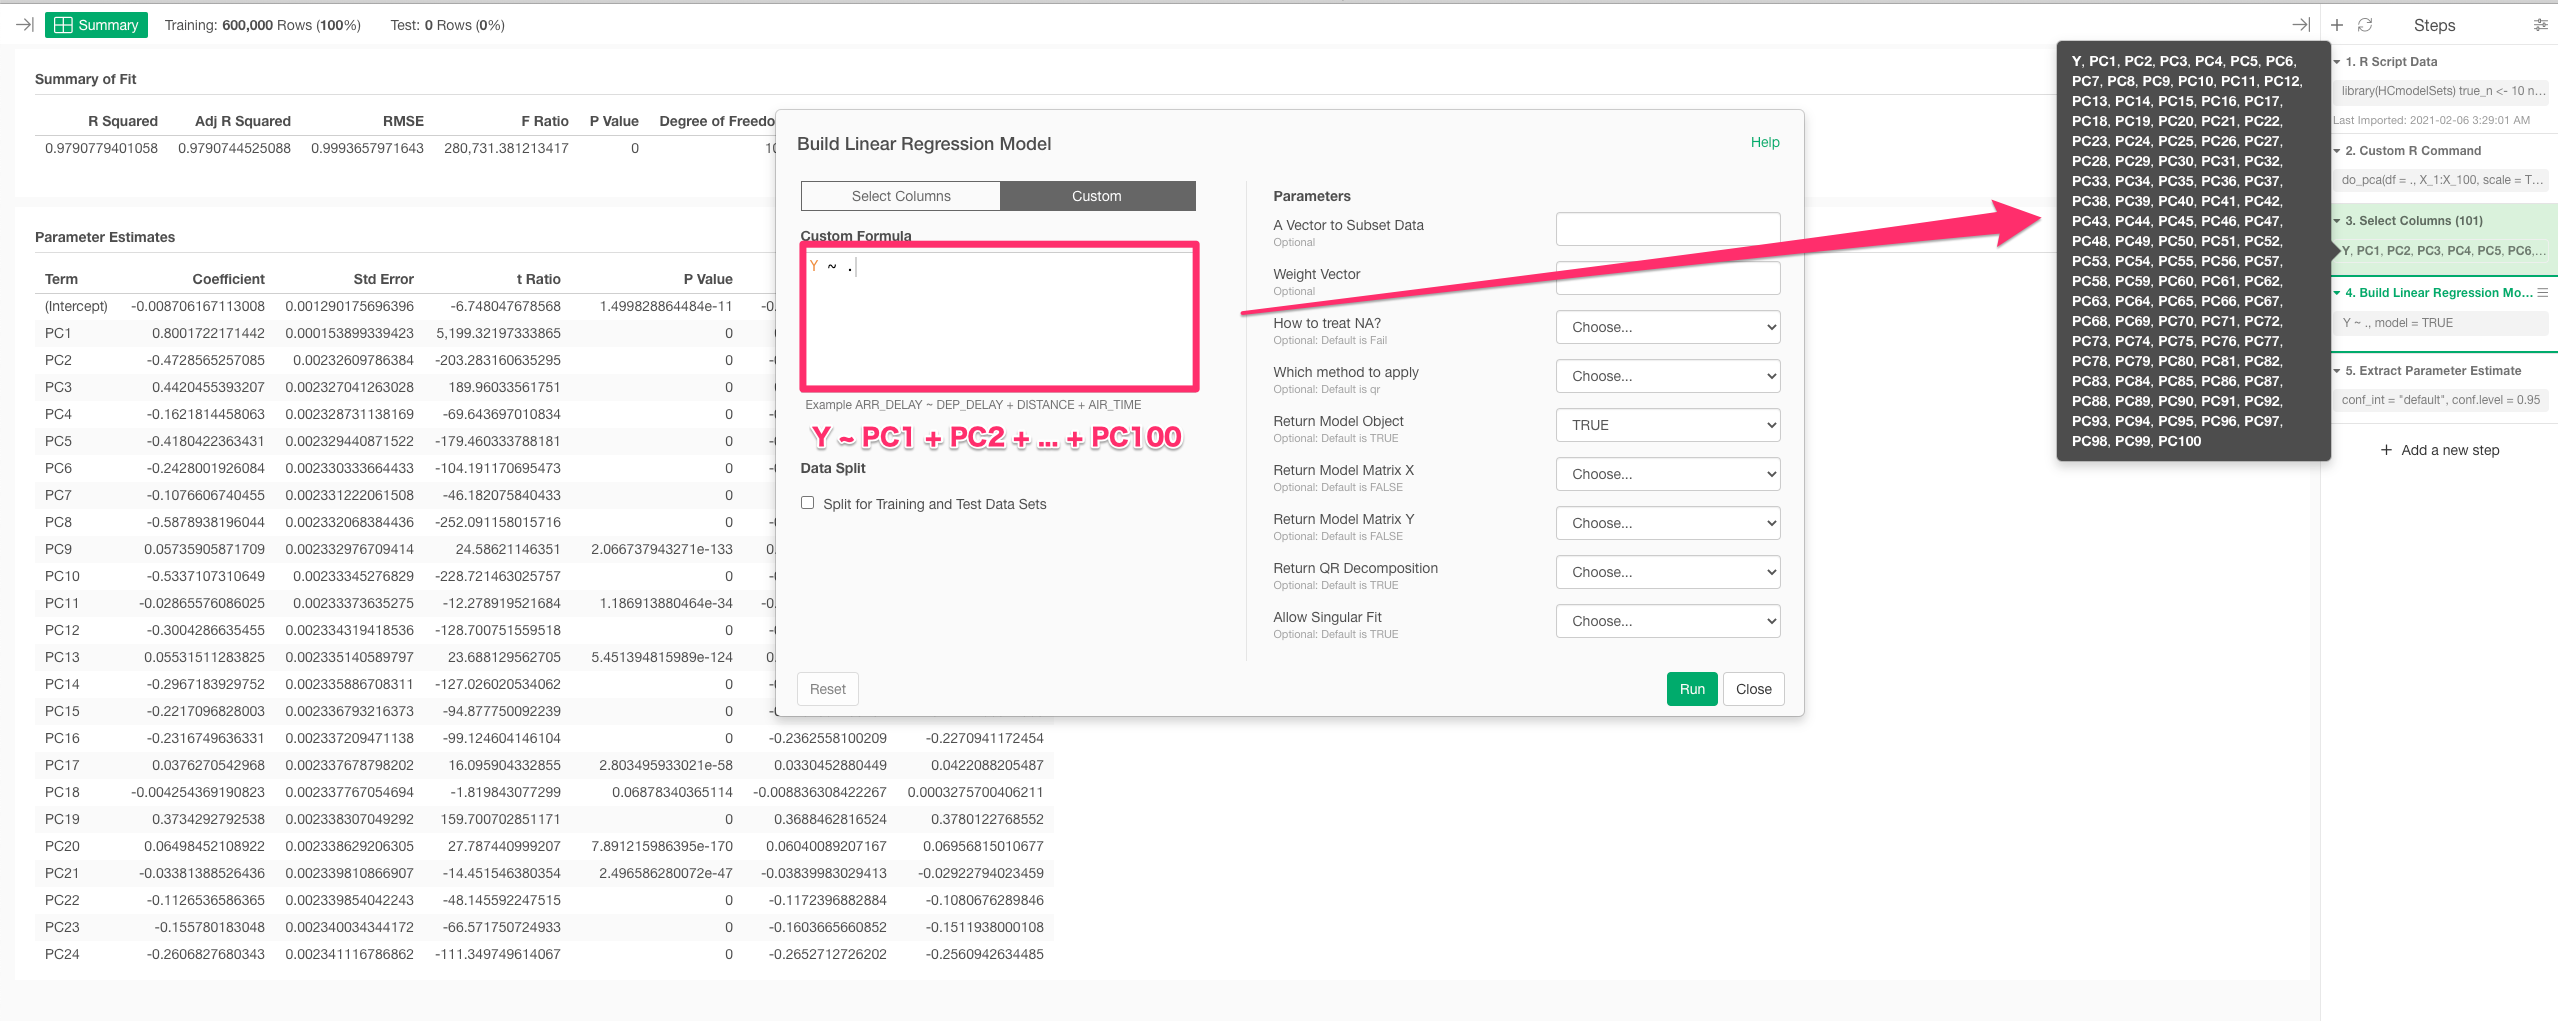
4. select needed col & do Linear Regression
5. visualize

Hi Natasha,
You can change the sample size setting.
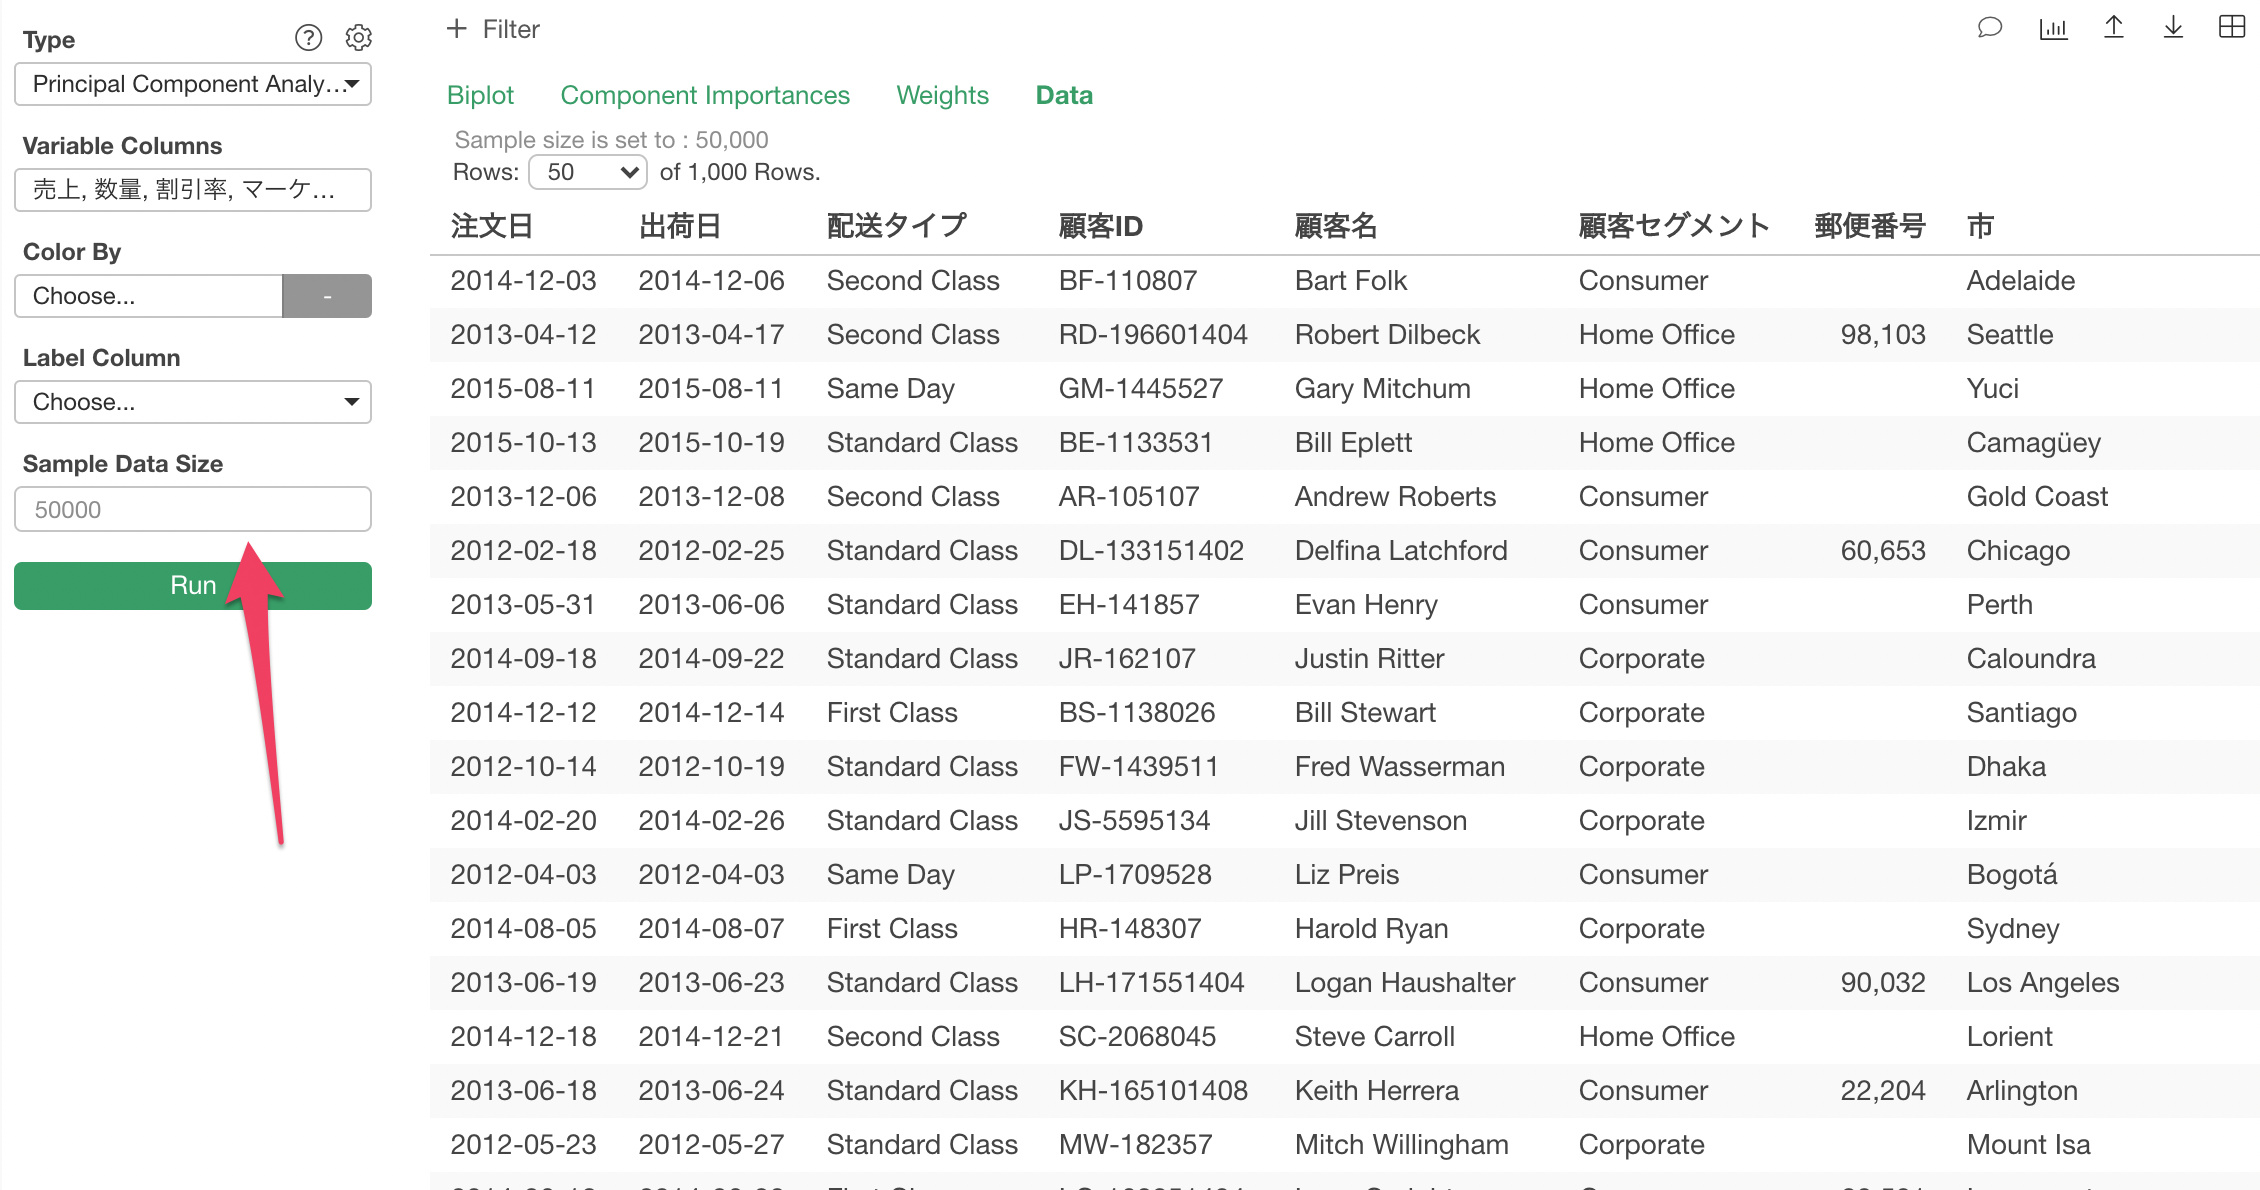
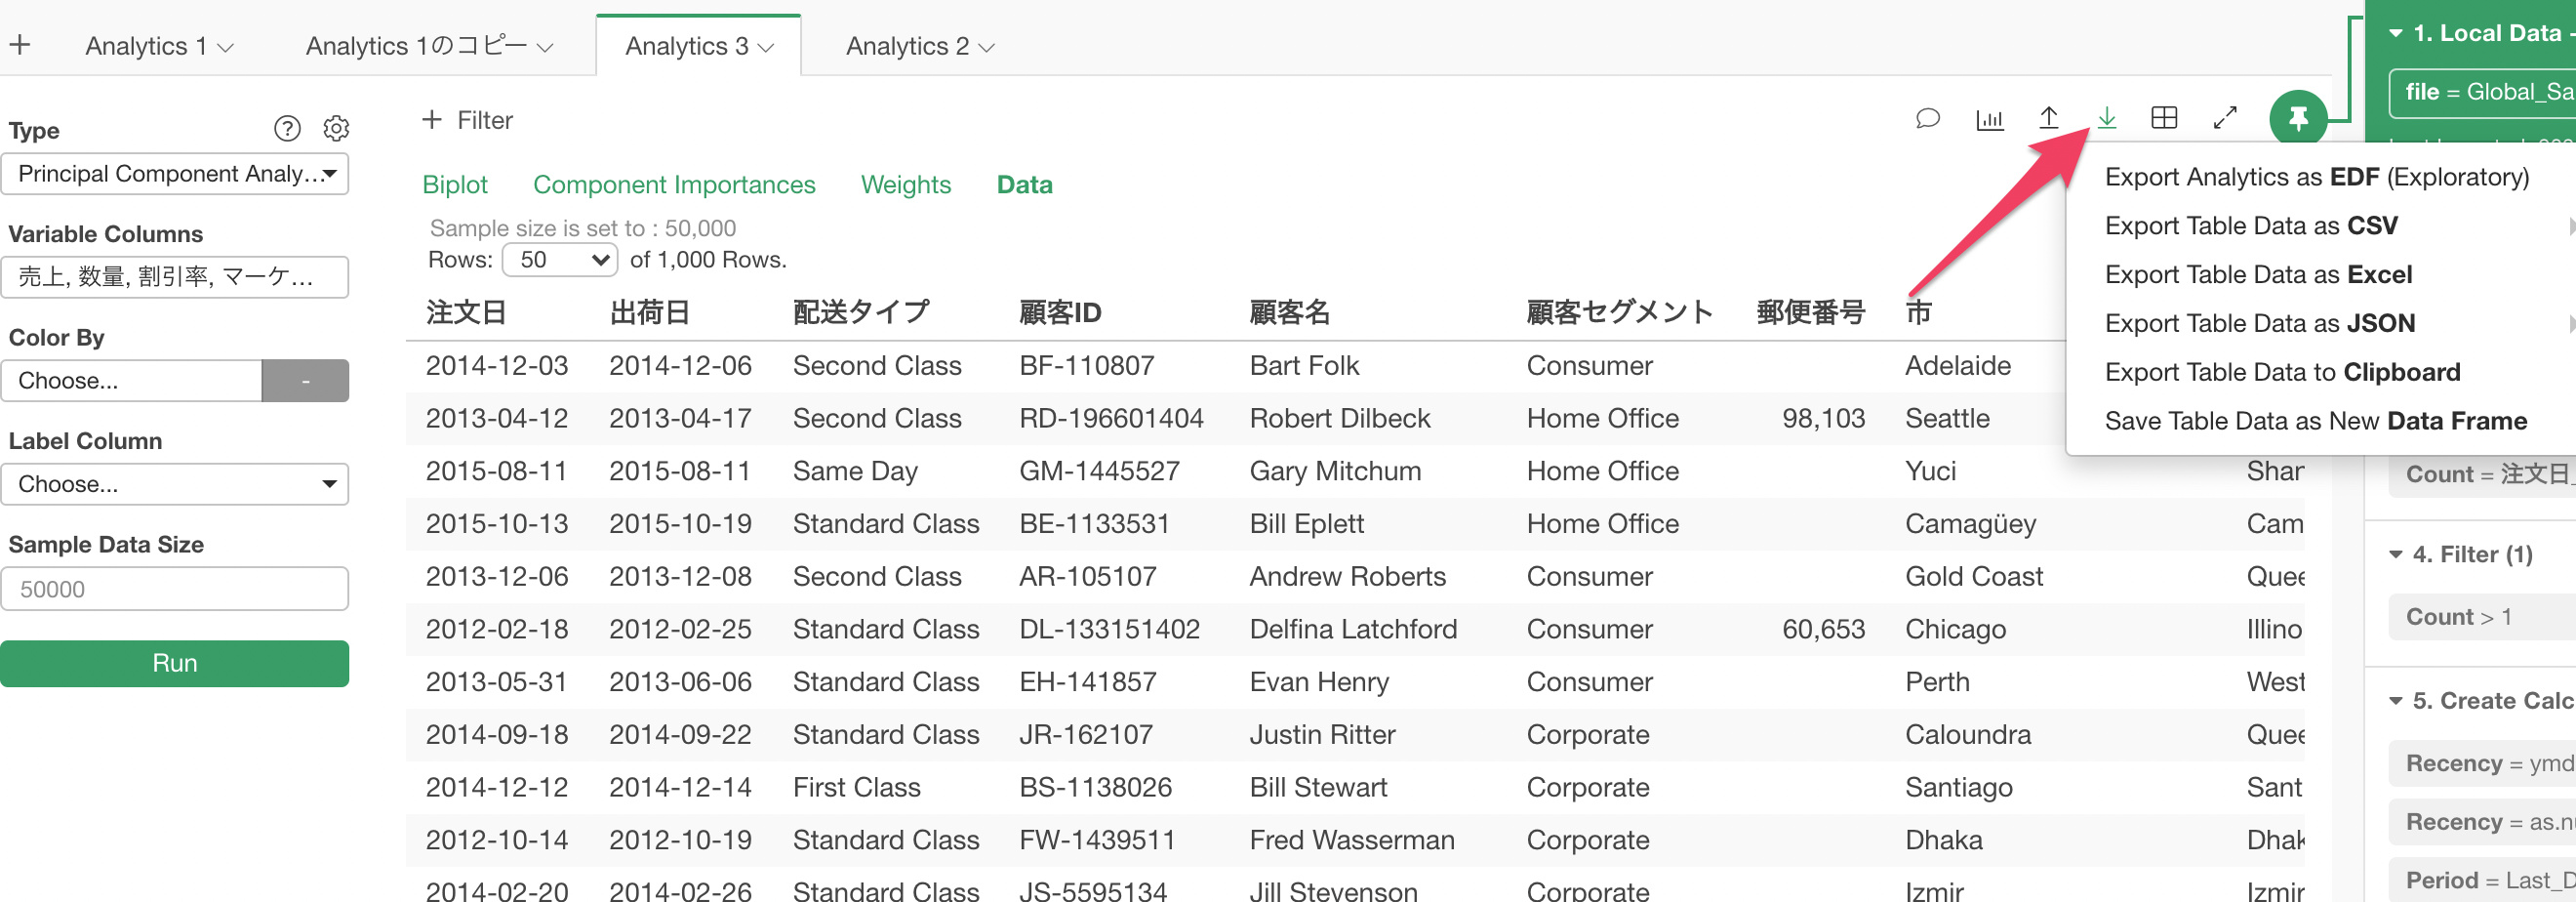
But, even if you change the sample size the data shown in the table still has only 1,000 max. in order to see all the data you want to export.
-Kan
Hi sugiaki,
Thanks for your thorough answer :)!
Hi Kan,
Thanks for the tip on exporting to see all the data! I’m able to see more than 1000 now.
Can someone clarify for me what the values for each pca component for each row in my data means? It’s the eigenvalue for the component based on the weights of each variable that the specific row has? Does it follow that the principal component with the highest value explains that row the best? Such as:
Business 1 has pc1 -0.132, pc2 6.687, pc3 -0.768. Would pc2 be the ‘best’ dimension for business 1?
Also from anotherpost on pca in the community, in the weights table the weights are squared so the values in the row sum to 1. Is it possible to see the values before they are squared? From my understand the sum of the weights of the variables would equal the eigenvalue for the component? Is this info not needed since I have pc values for every row?
Thanks again for the help!