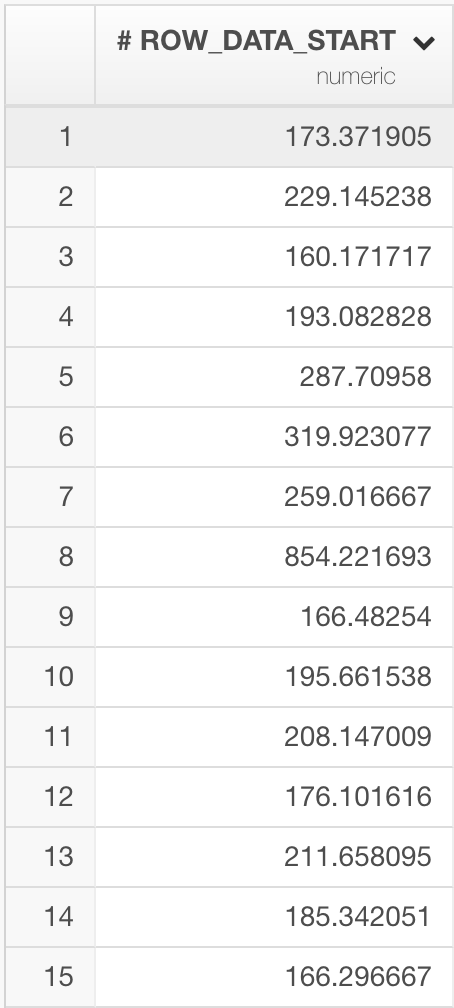
I would like to plot values on the X axis, however I have only Y column, is there an easy way to add row id to the dataframe, or is there other way I could plot the data?
Thank you!
I would like to plot values on the X axis, however I have only Y column, is there an easy way to add row id to the dataframe, or is there other way I could plot the data?
Thank you!
Yes, you can select ‘Mutate - Create Calculation’ from the column header menu or the Plus button. Then type
row_number()
in the calculation area.
This will generate a row id for each row.
Cheers,
Kan