I was trying to follow the recent blog post about Small Multiple to explore a bit the v2.2.
I came across the following difficulties:
(i) after zooming in, how do I zoom out / reset to the original plot?
(Must I click the Summary or Table tabs and then click back the Viz to refresh?)
(ii) Apparently, when I pin and unpin a chart, it is refreshed but does not return to the original plot (eg, the interval of the x-axis changes after each pin and unpin; there does not seem to be a systematic pattern in such unintended changes.) Similar unintended changes occur when clicking the Summary or Table tabs and then clicking back the Viz to refresh.
You can double click on any part of the chart to zoom back to the original. We’ll document this.
Would you give me a sample data to reproduce this issue with the steps? You can share the chart by clicking on Share button in either Public or Private way.
I also made a short video so that you can see the issue I experienced.
Not sure it’s reproducible on your machine. But I did try the v2.2 in a Dell desktop pc Win7 and also recorded the same issue in a Samsung notebook Win7.
Thanks tlyim for sharing the data and making the video!
We’ll check if we can reproduce this on Windows. I’m on Mac and working fine for me, so it might be that it’s Windows specific issue.
Thanks for the video on this. I think this is because we sample the data for Scatterplot when there are too many data points, which is causing the issue that the data keep getting changed when you pin/unpin. We’ll add ‘seed’ feature for this so that it will use a same sample data.
Thanks for the reply. An off-track question: Is there or not any particular support for panel data by Exploratory at the moment? If so, please kindly point me to any documentation because I haven’t been able to find them.
For example, if I want to create a variable involving the simple moving average of two periods of another variable, should I simply do the following?
group by company
sort by datayear
mutate with lag(income)
mutate with (income + lag(income))/2
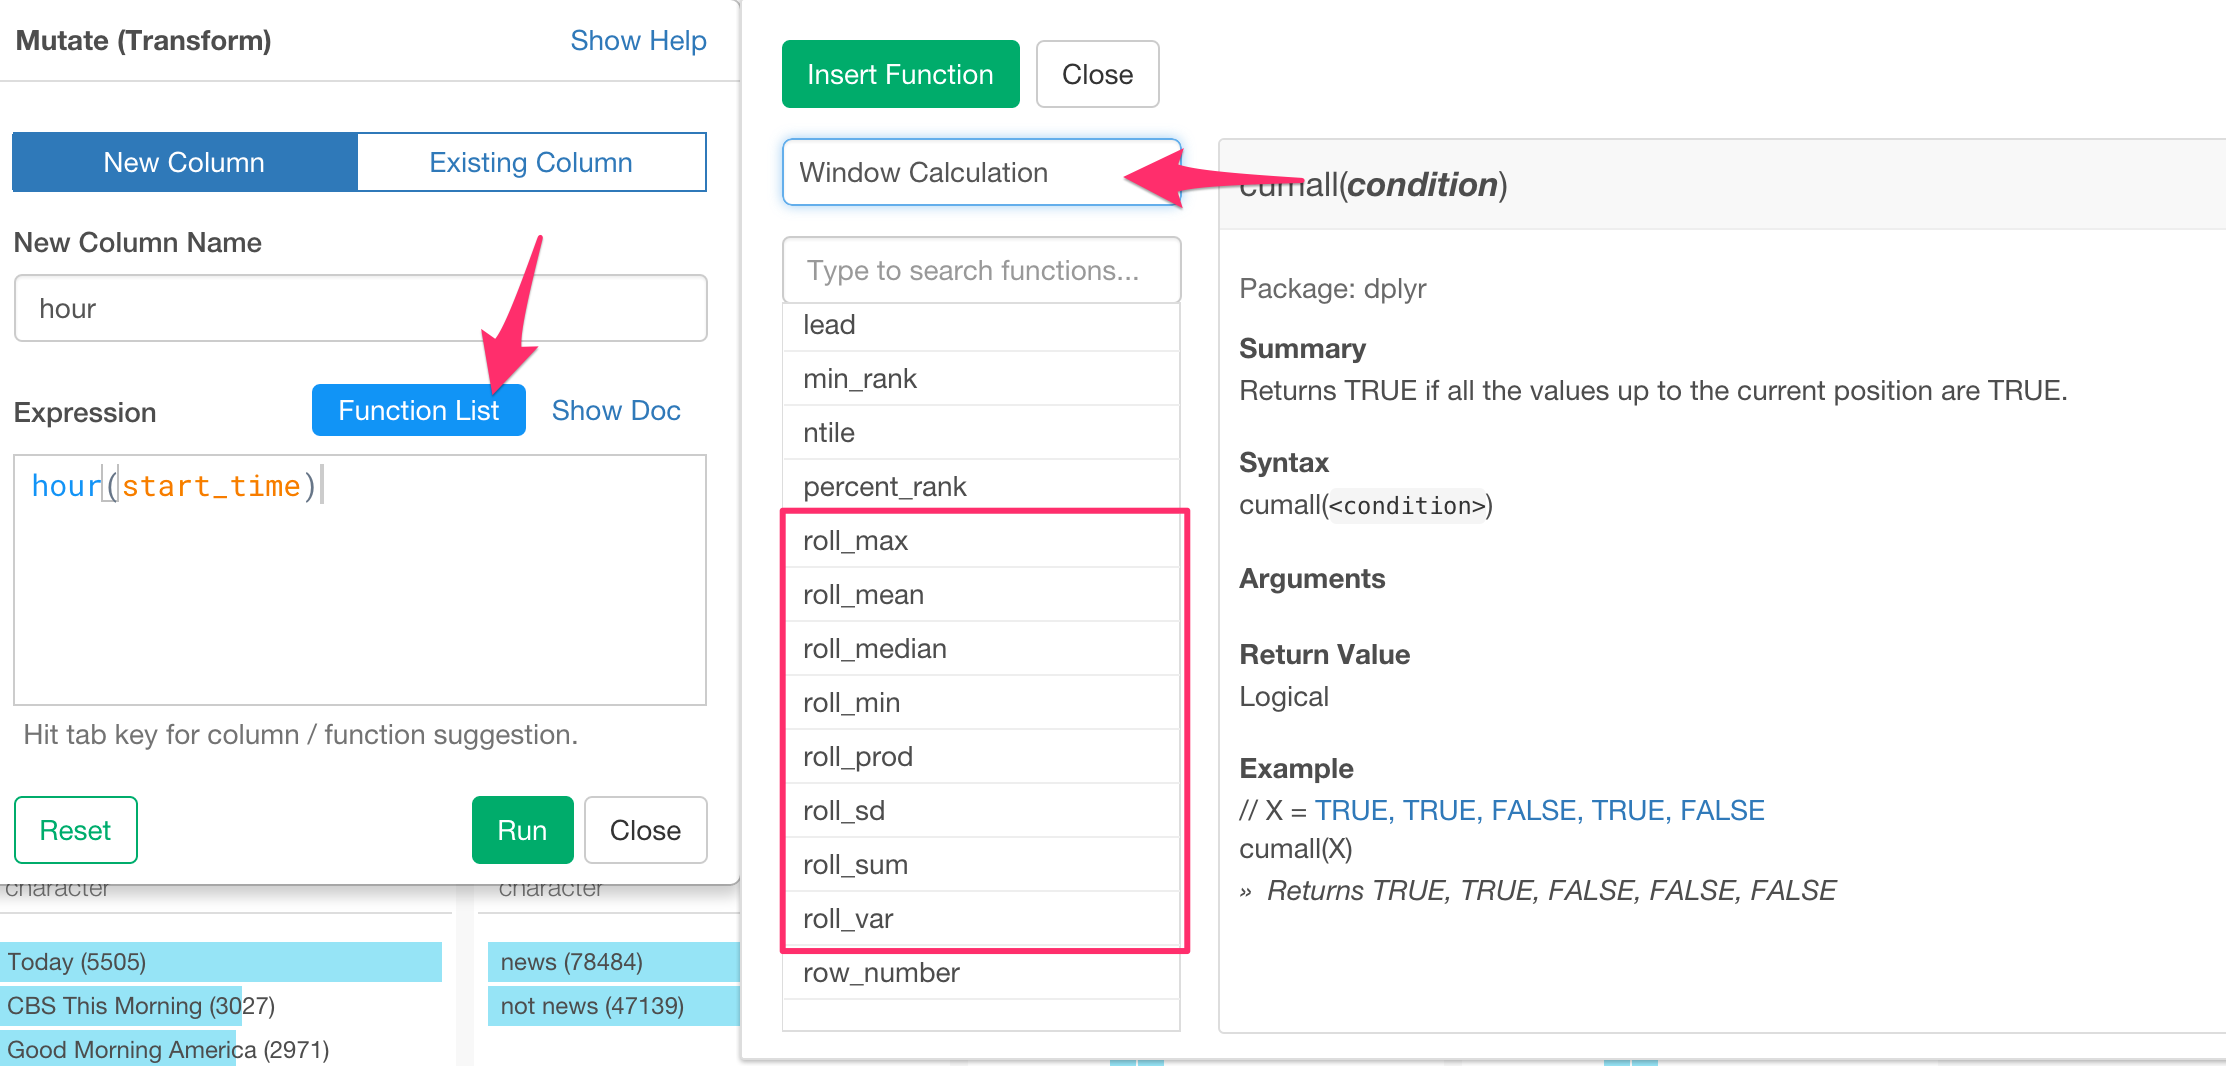
Yes, that should do it, if you’re interested in only the two period. But also, you can use ‘roll_xxx’ function to work on the moving/rolling calculations as well.