Hi, i’m stuck in an analyses and hope someone can help. I have a DF with columns with a startdate and an enddate. Startdate en enddate could be in the same year or years apart. These two fields mark start and end of the period an entity was active. Now i want to get the total active entities per year for a given period. How do i approach this?
Hi Just,
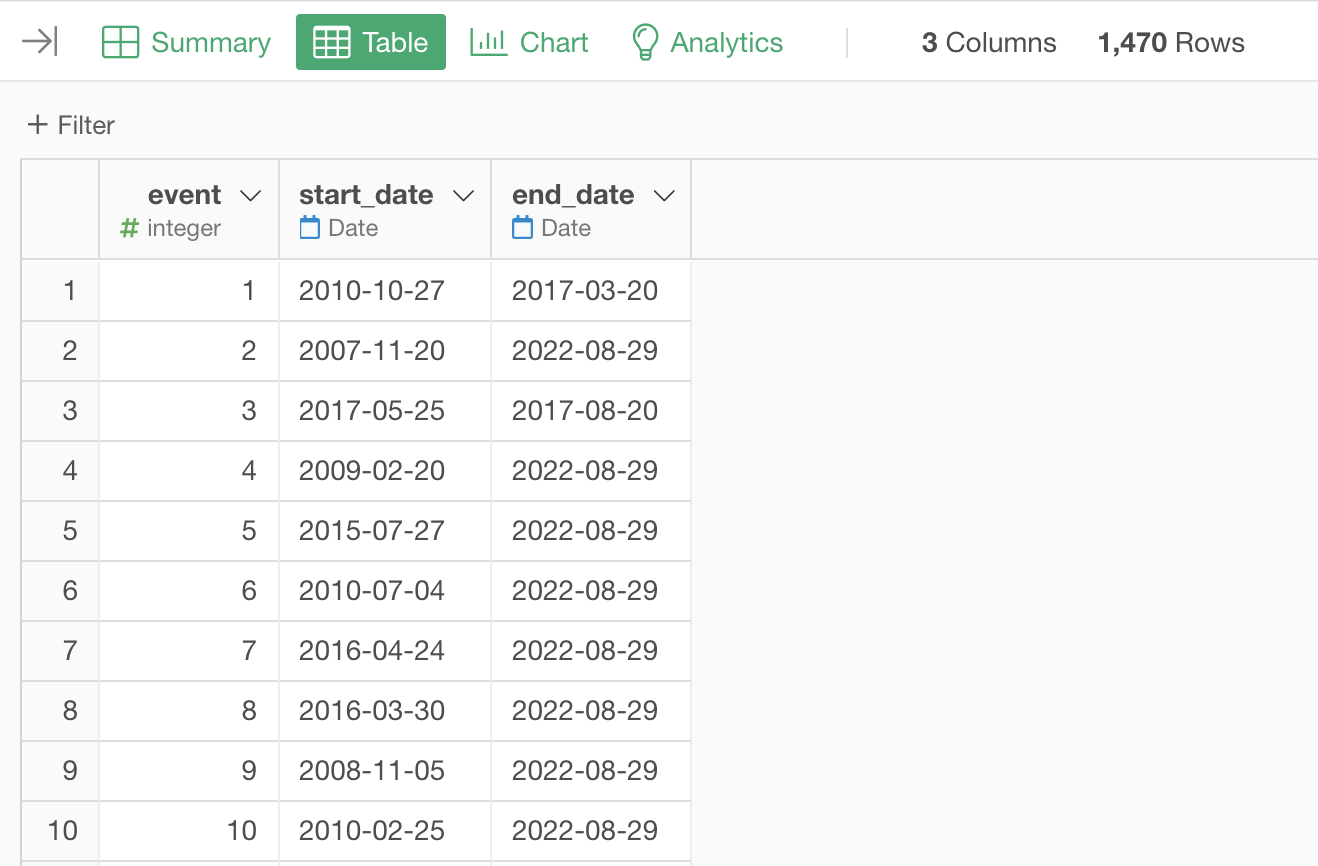
Let’s assume you have “start_date” and “end_date” columns along with the event id in a data frame.
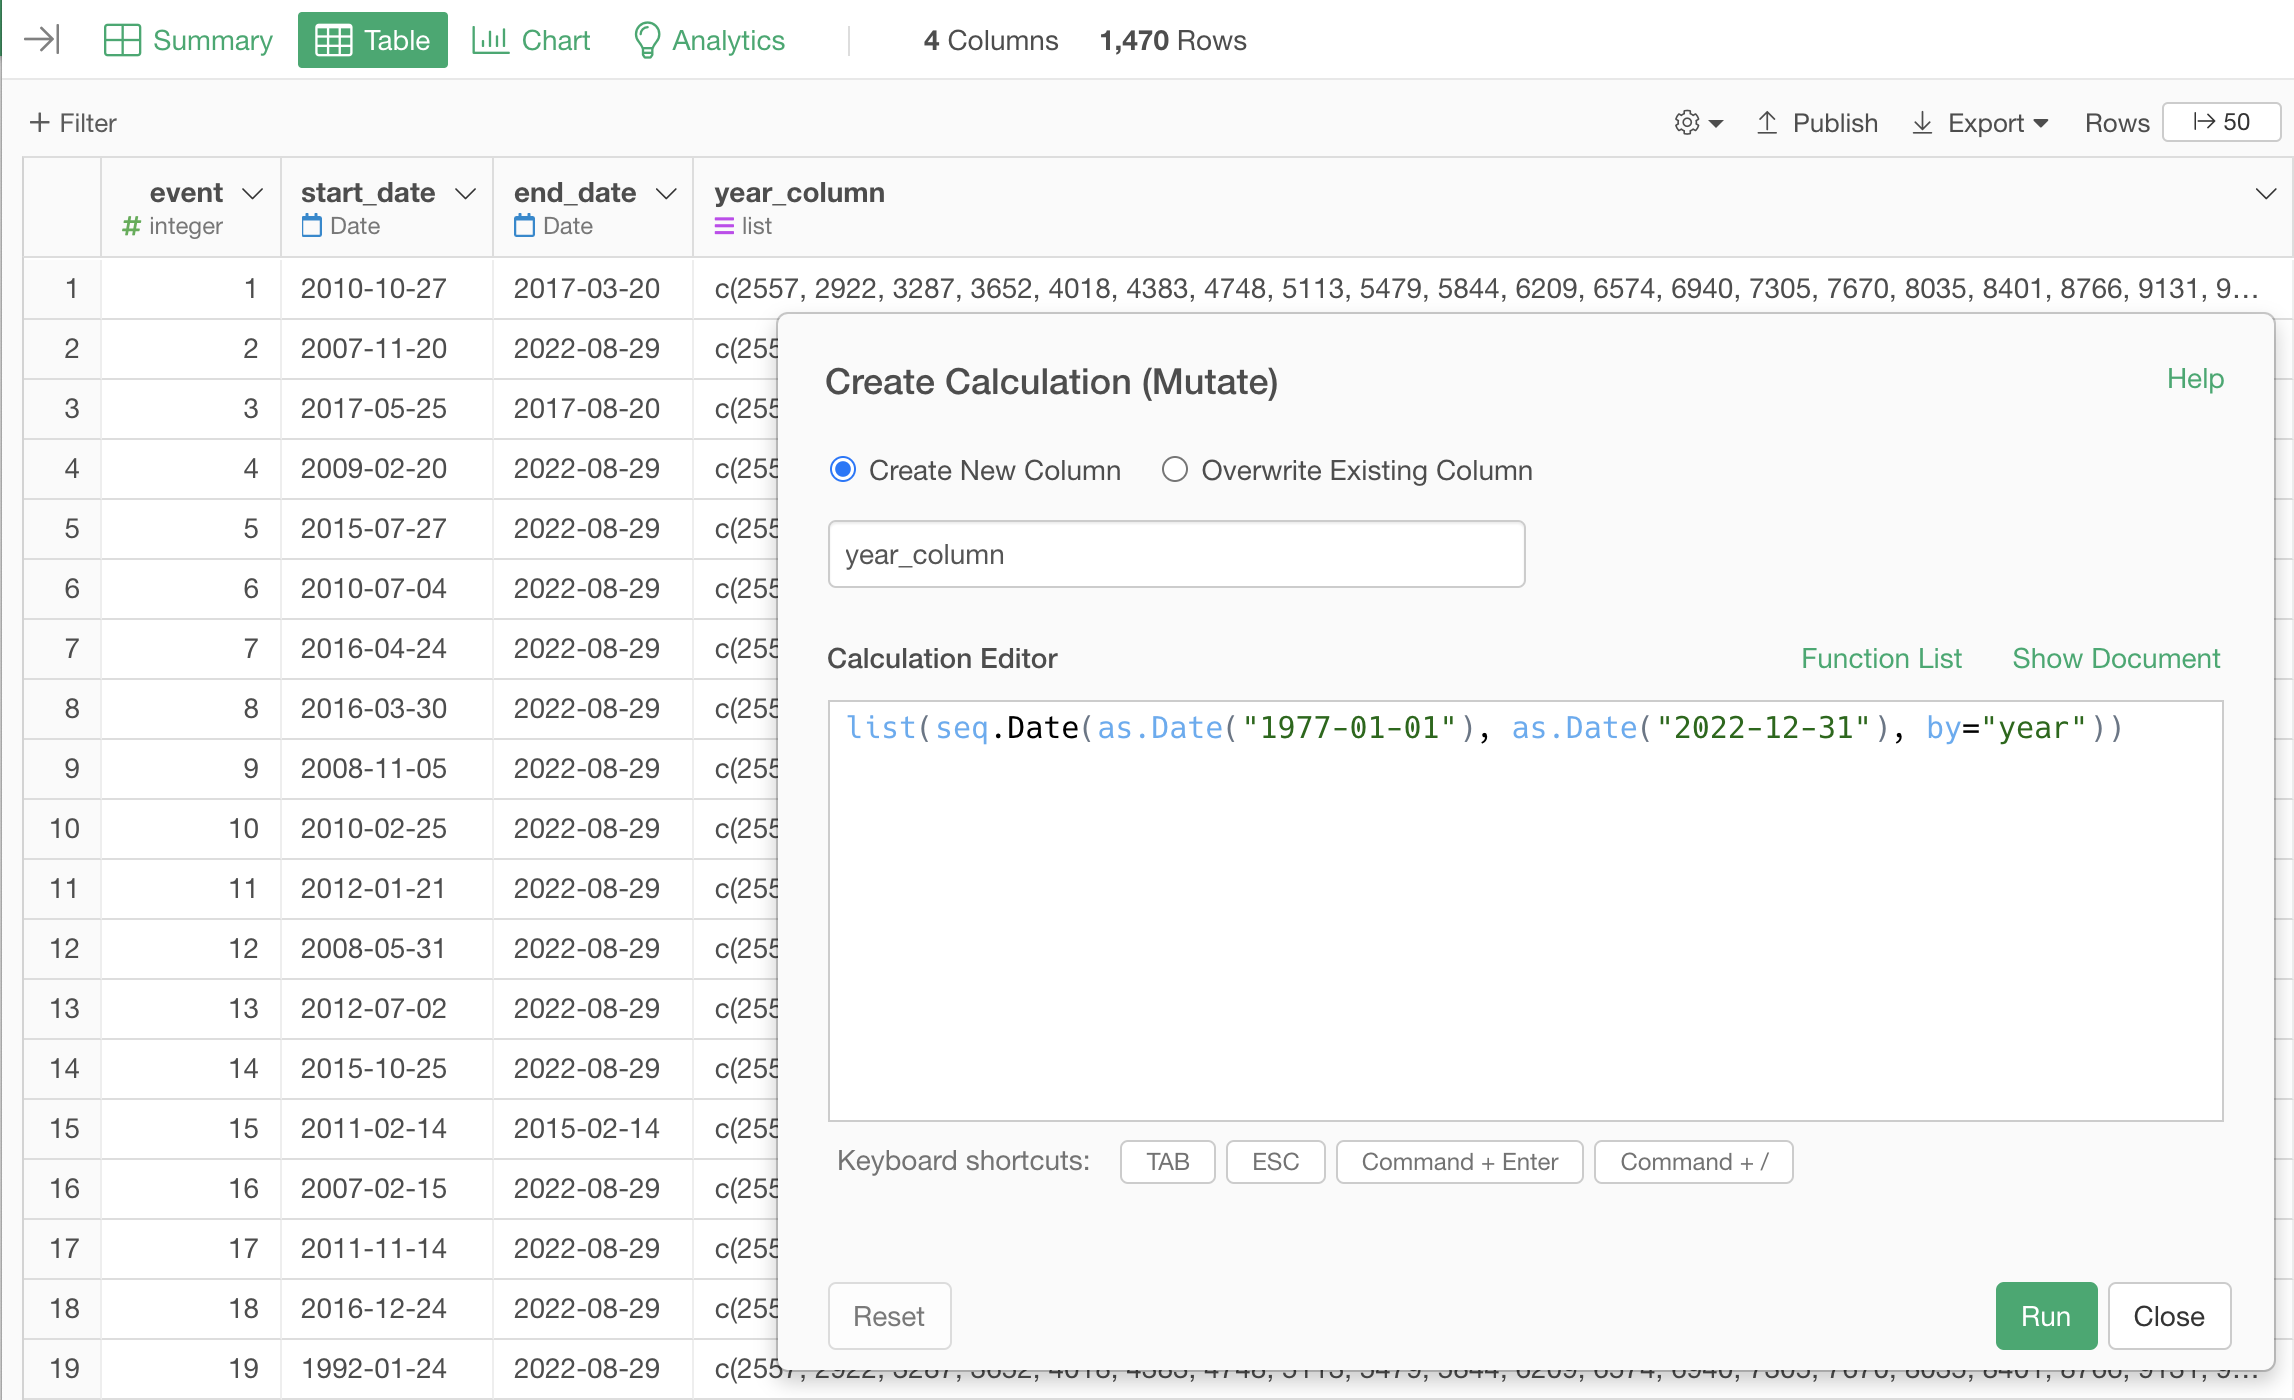
- Create a column for “year”
For example, if you want to know active entities from the year 1977 to the year 2022, you can create a column like this.
list(seq.Date(as.Date("1977-01-01"), as.Date("2022-12-31"), by="year"))
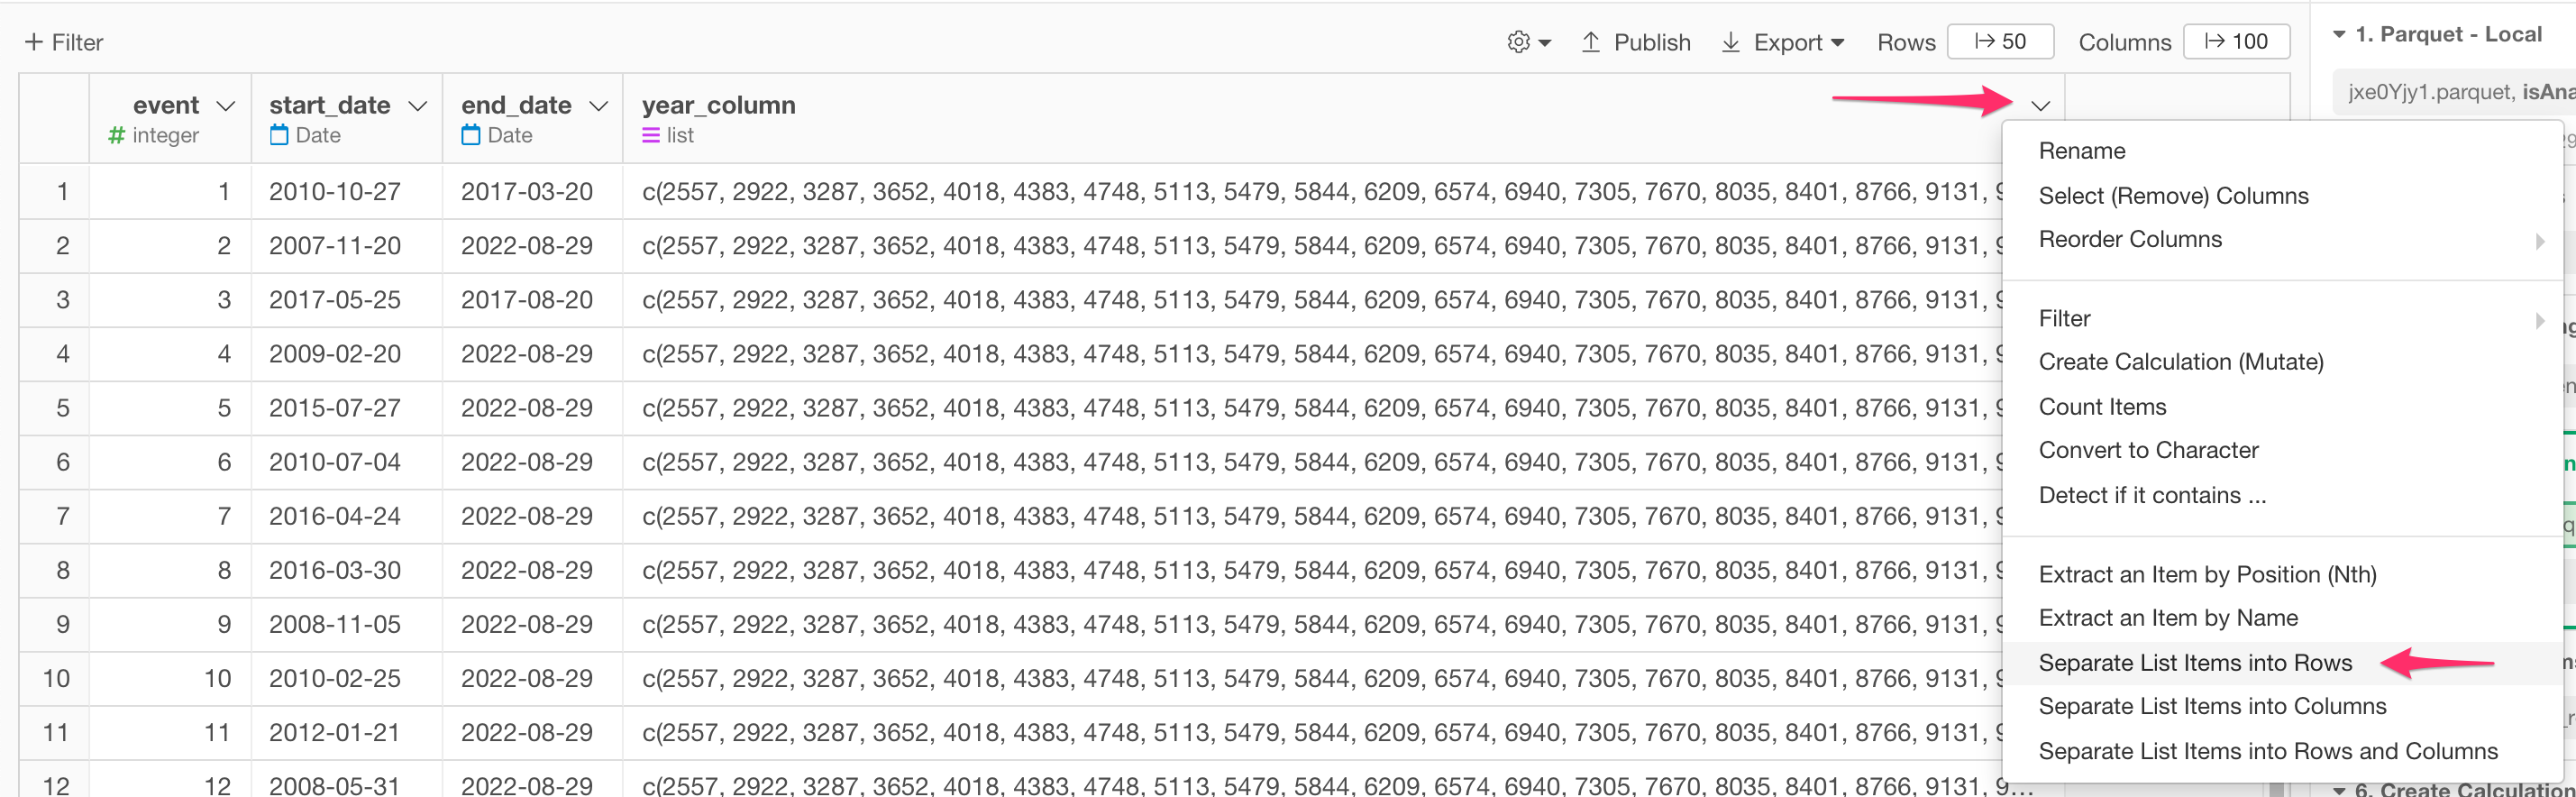
- Separate the year_column into rows
At this point, year_column’s data type is a list so let’s separate it into rows.
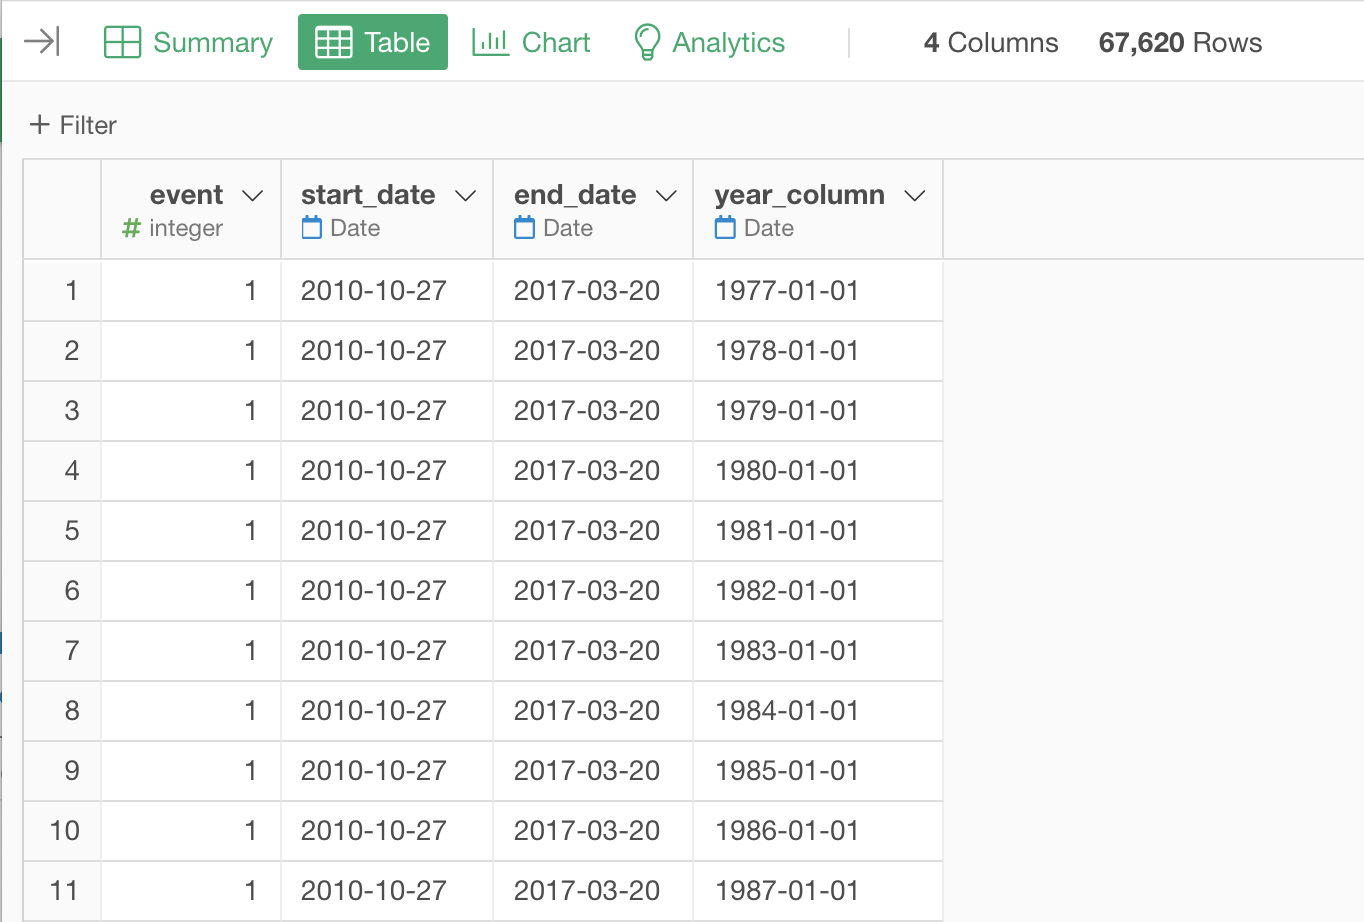
With this operation, you now have a data frame like the one below. so for each event, you have rows from year 1977 to year 2022 (one row represents a year)
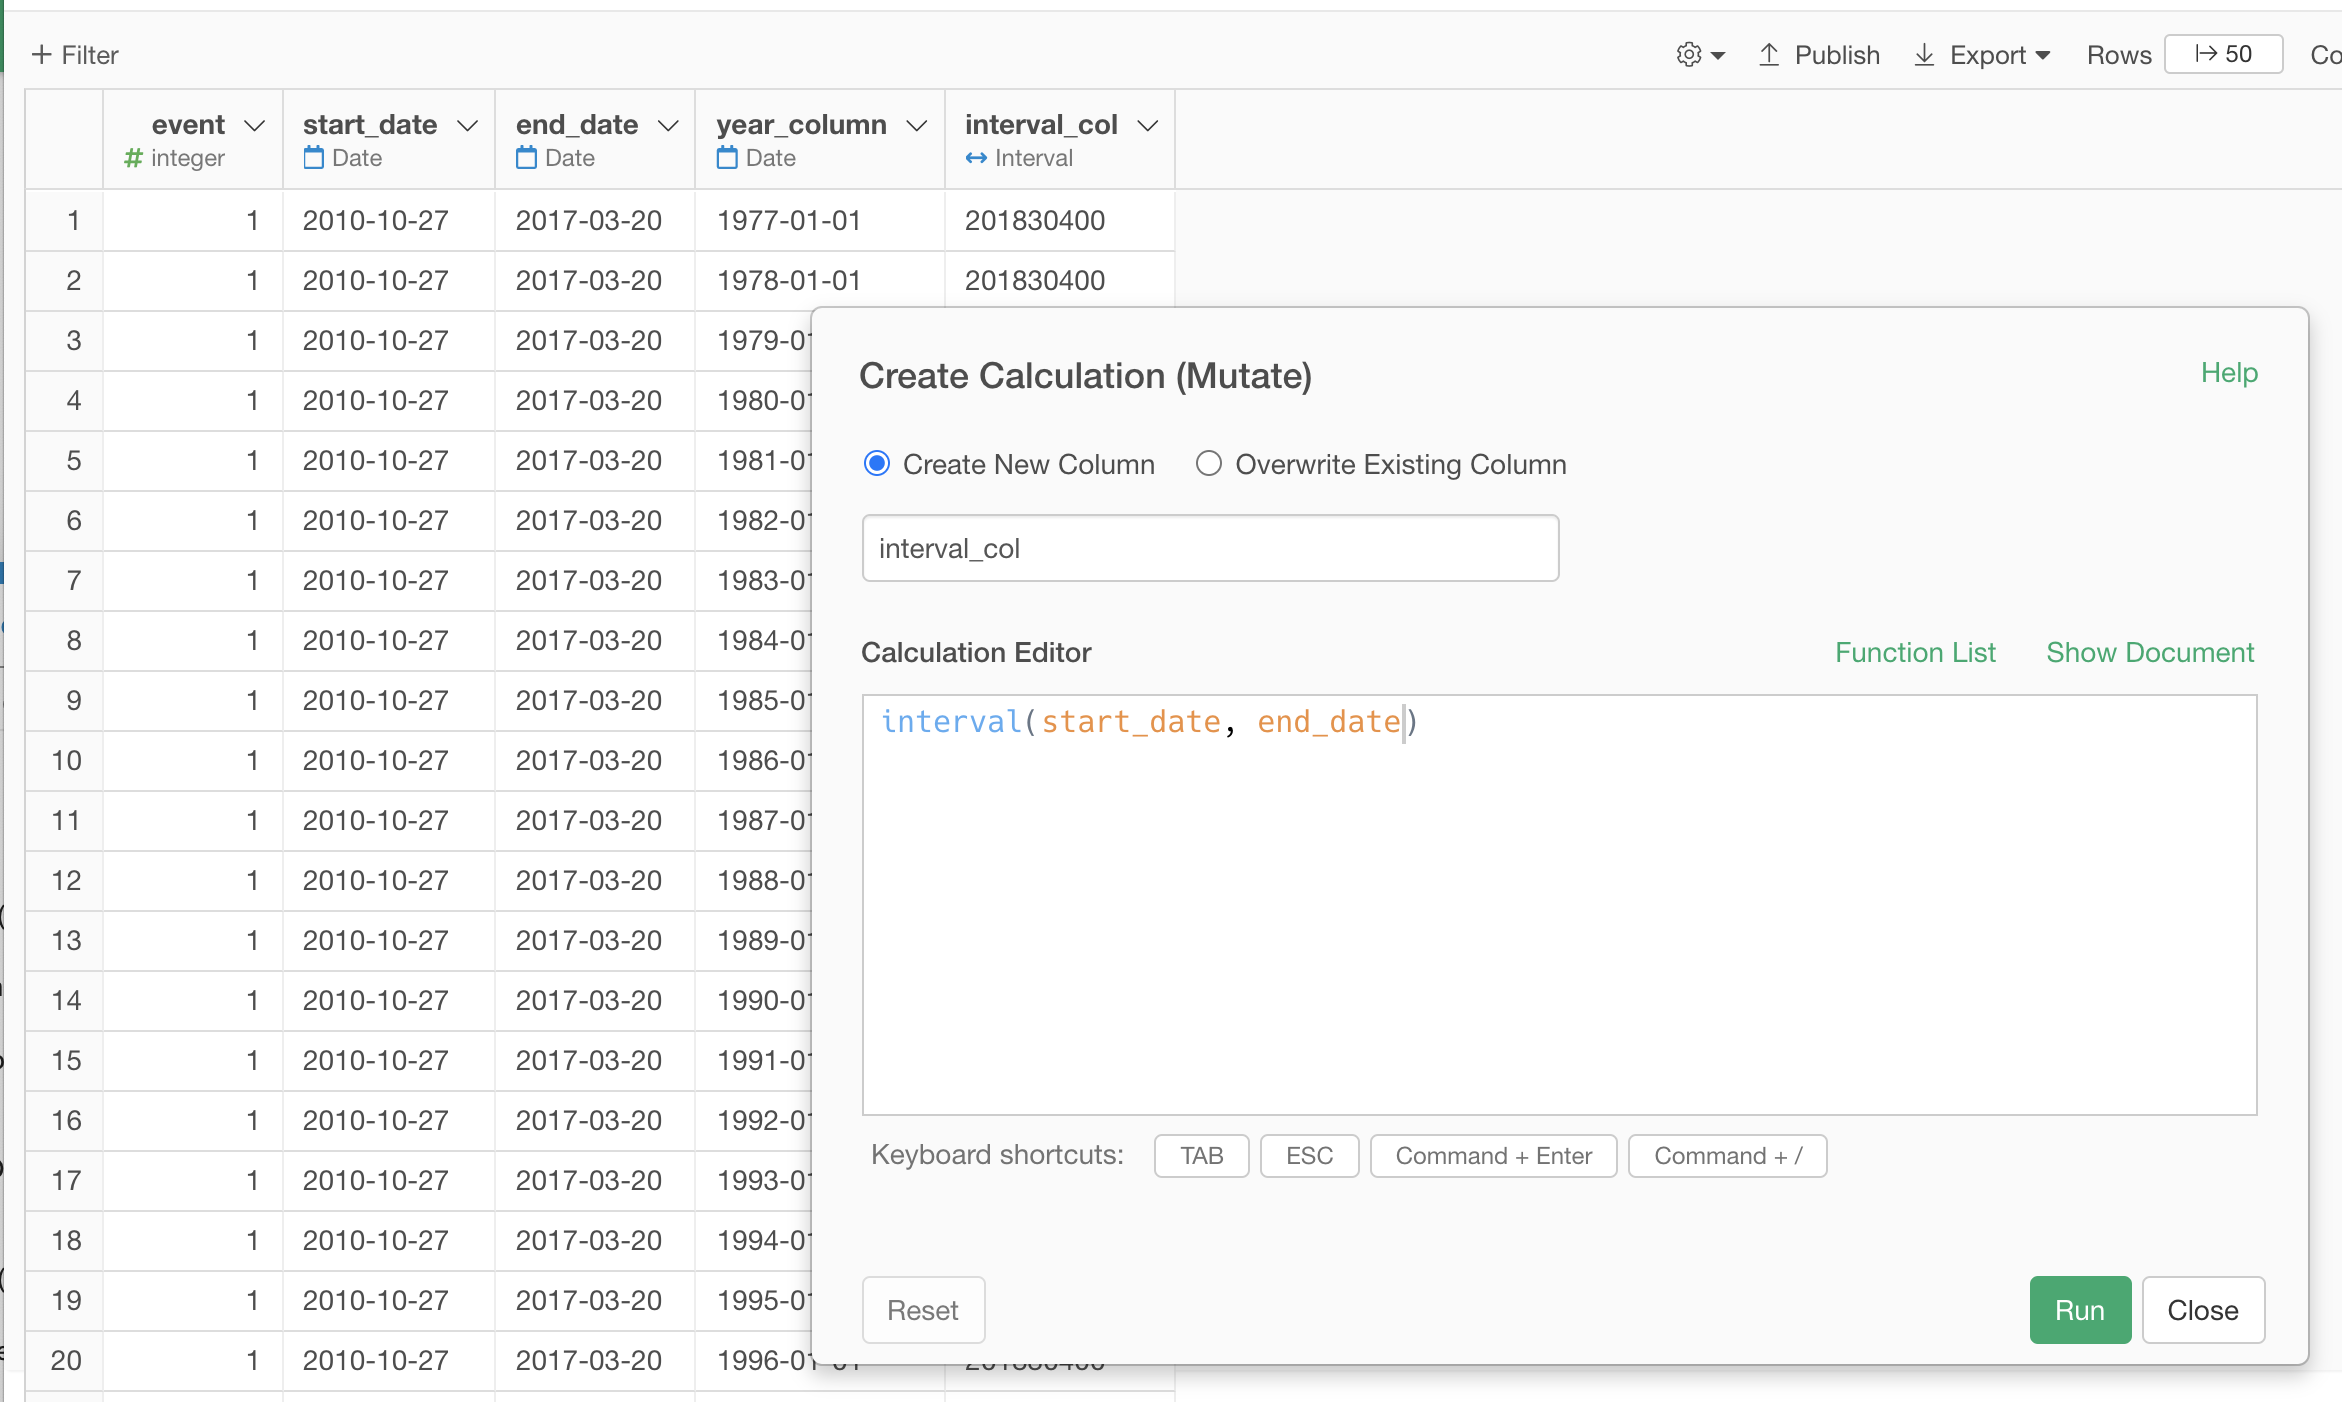
- Calculate the interval between start_date and end_date
interval(start_date, end_date)
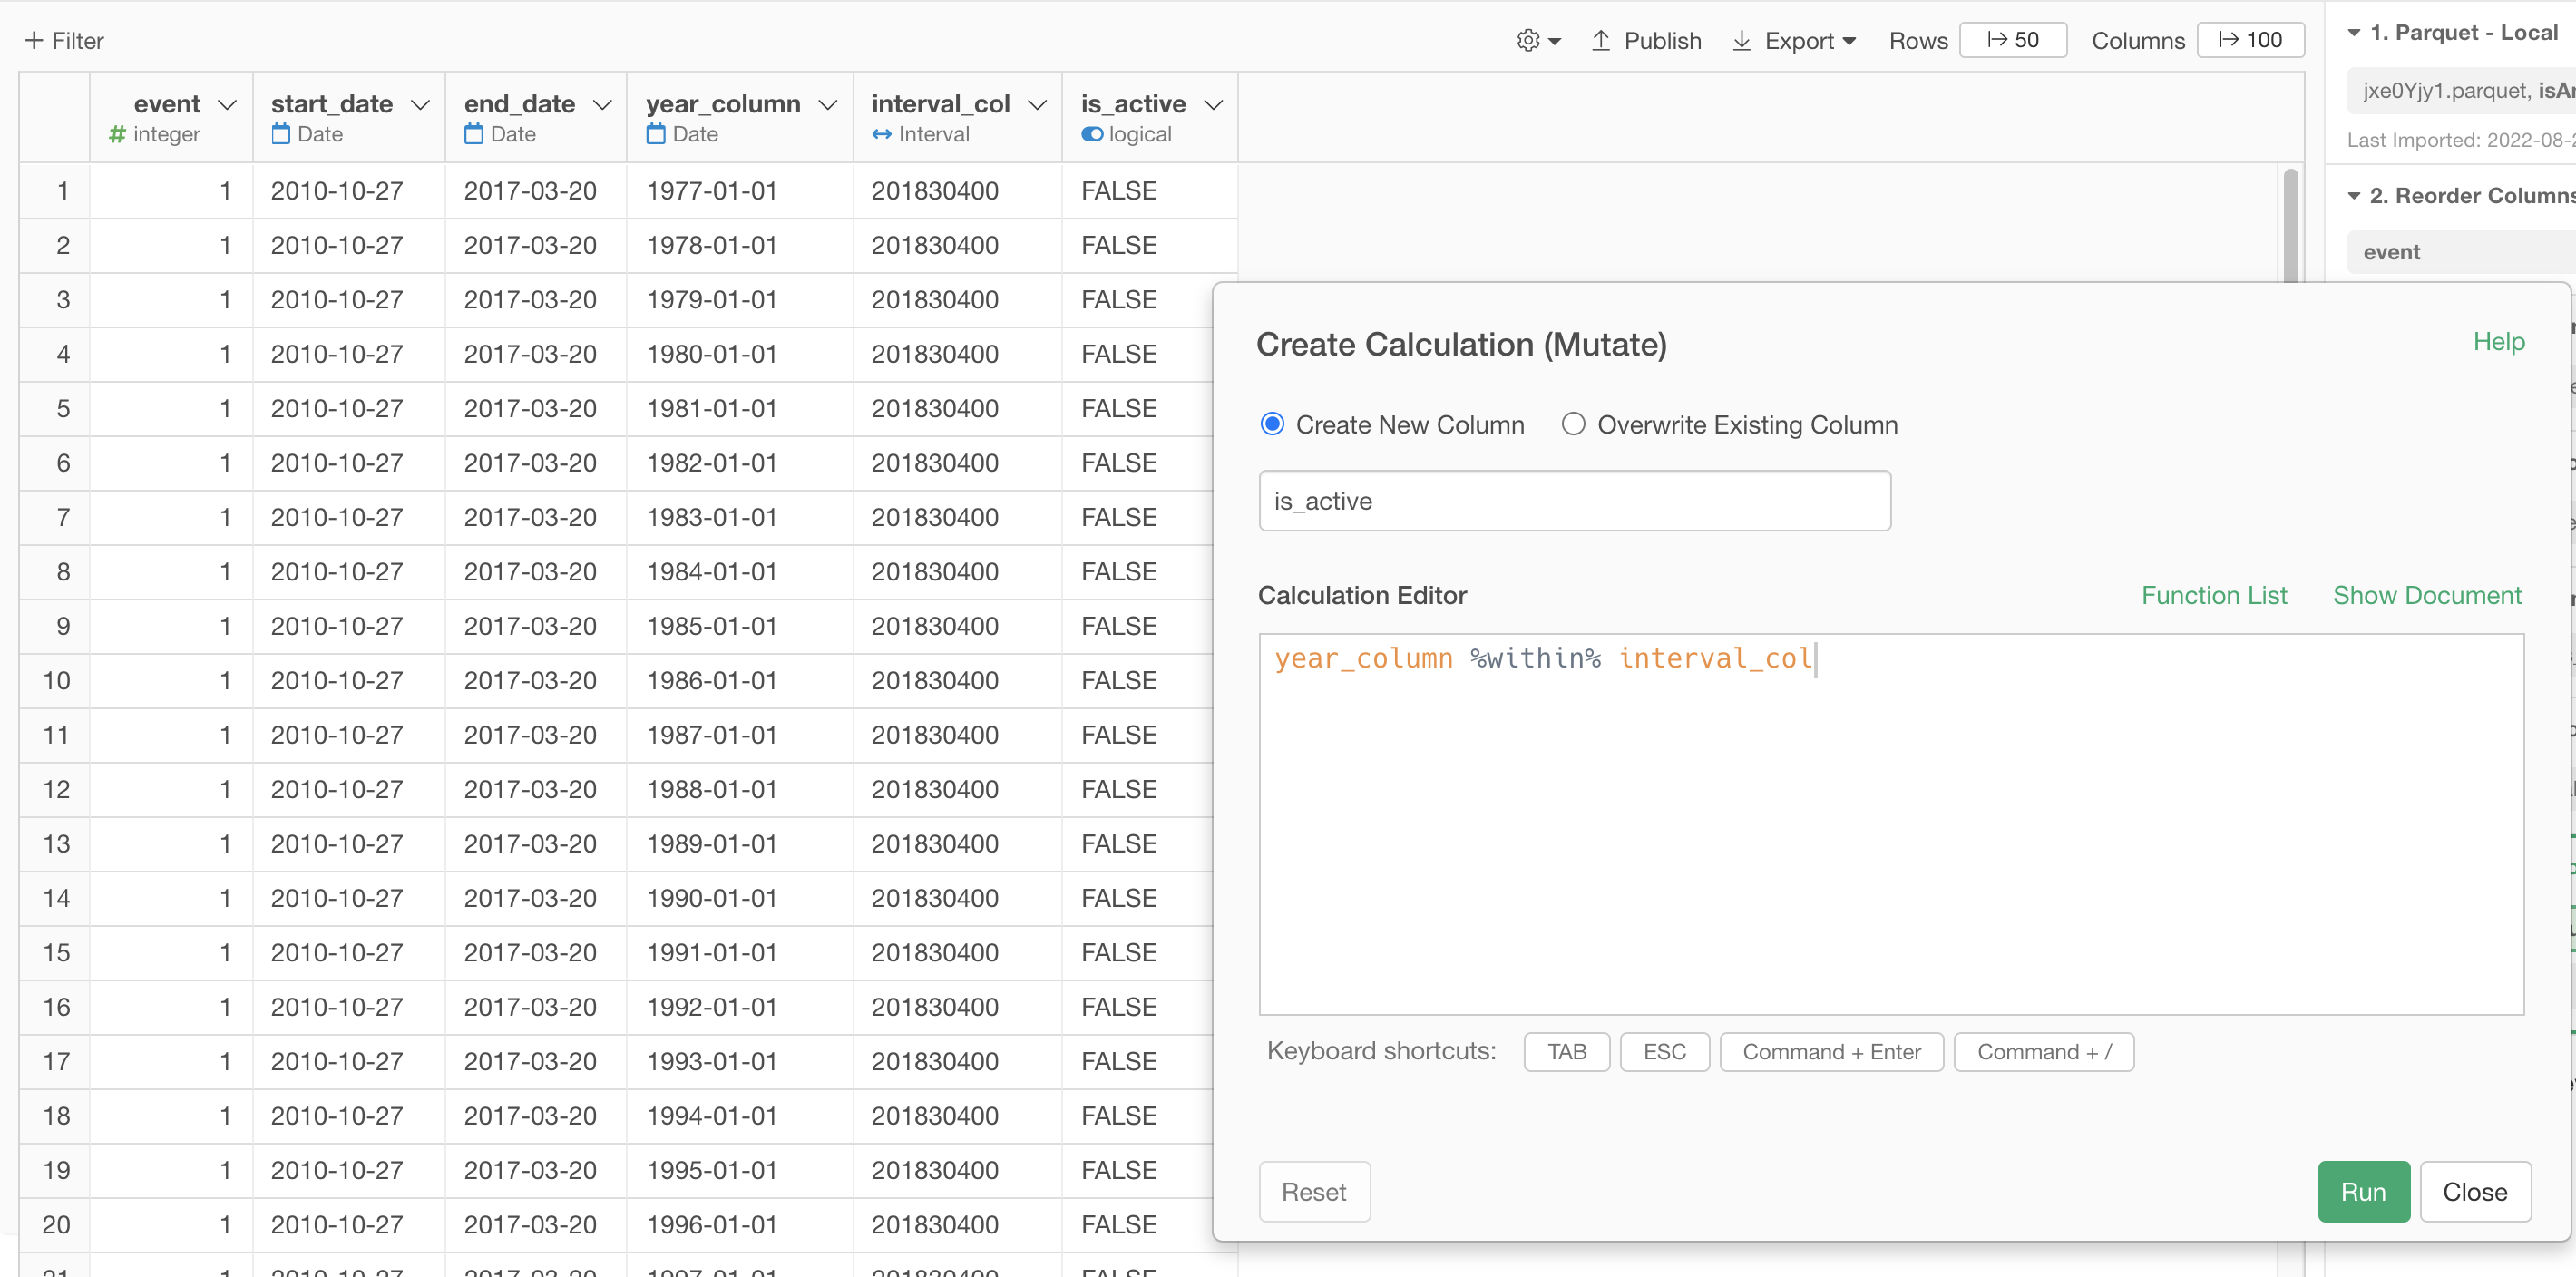
- Detect if the event is active for each year
To detect if the event is active for each year (i.e. each row), create the is_active column as follows.
year_column %within% interval_col
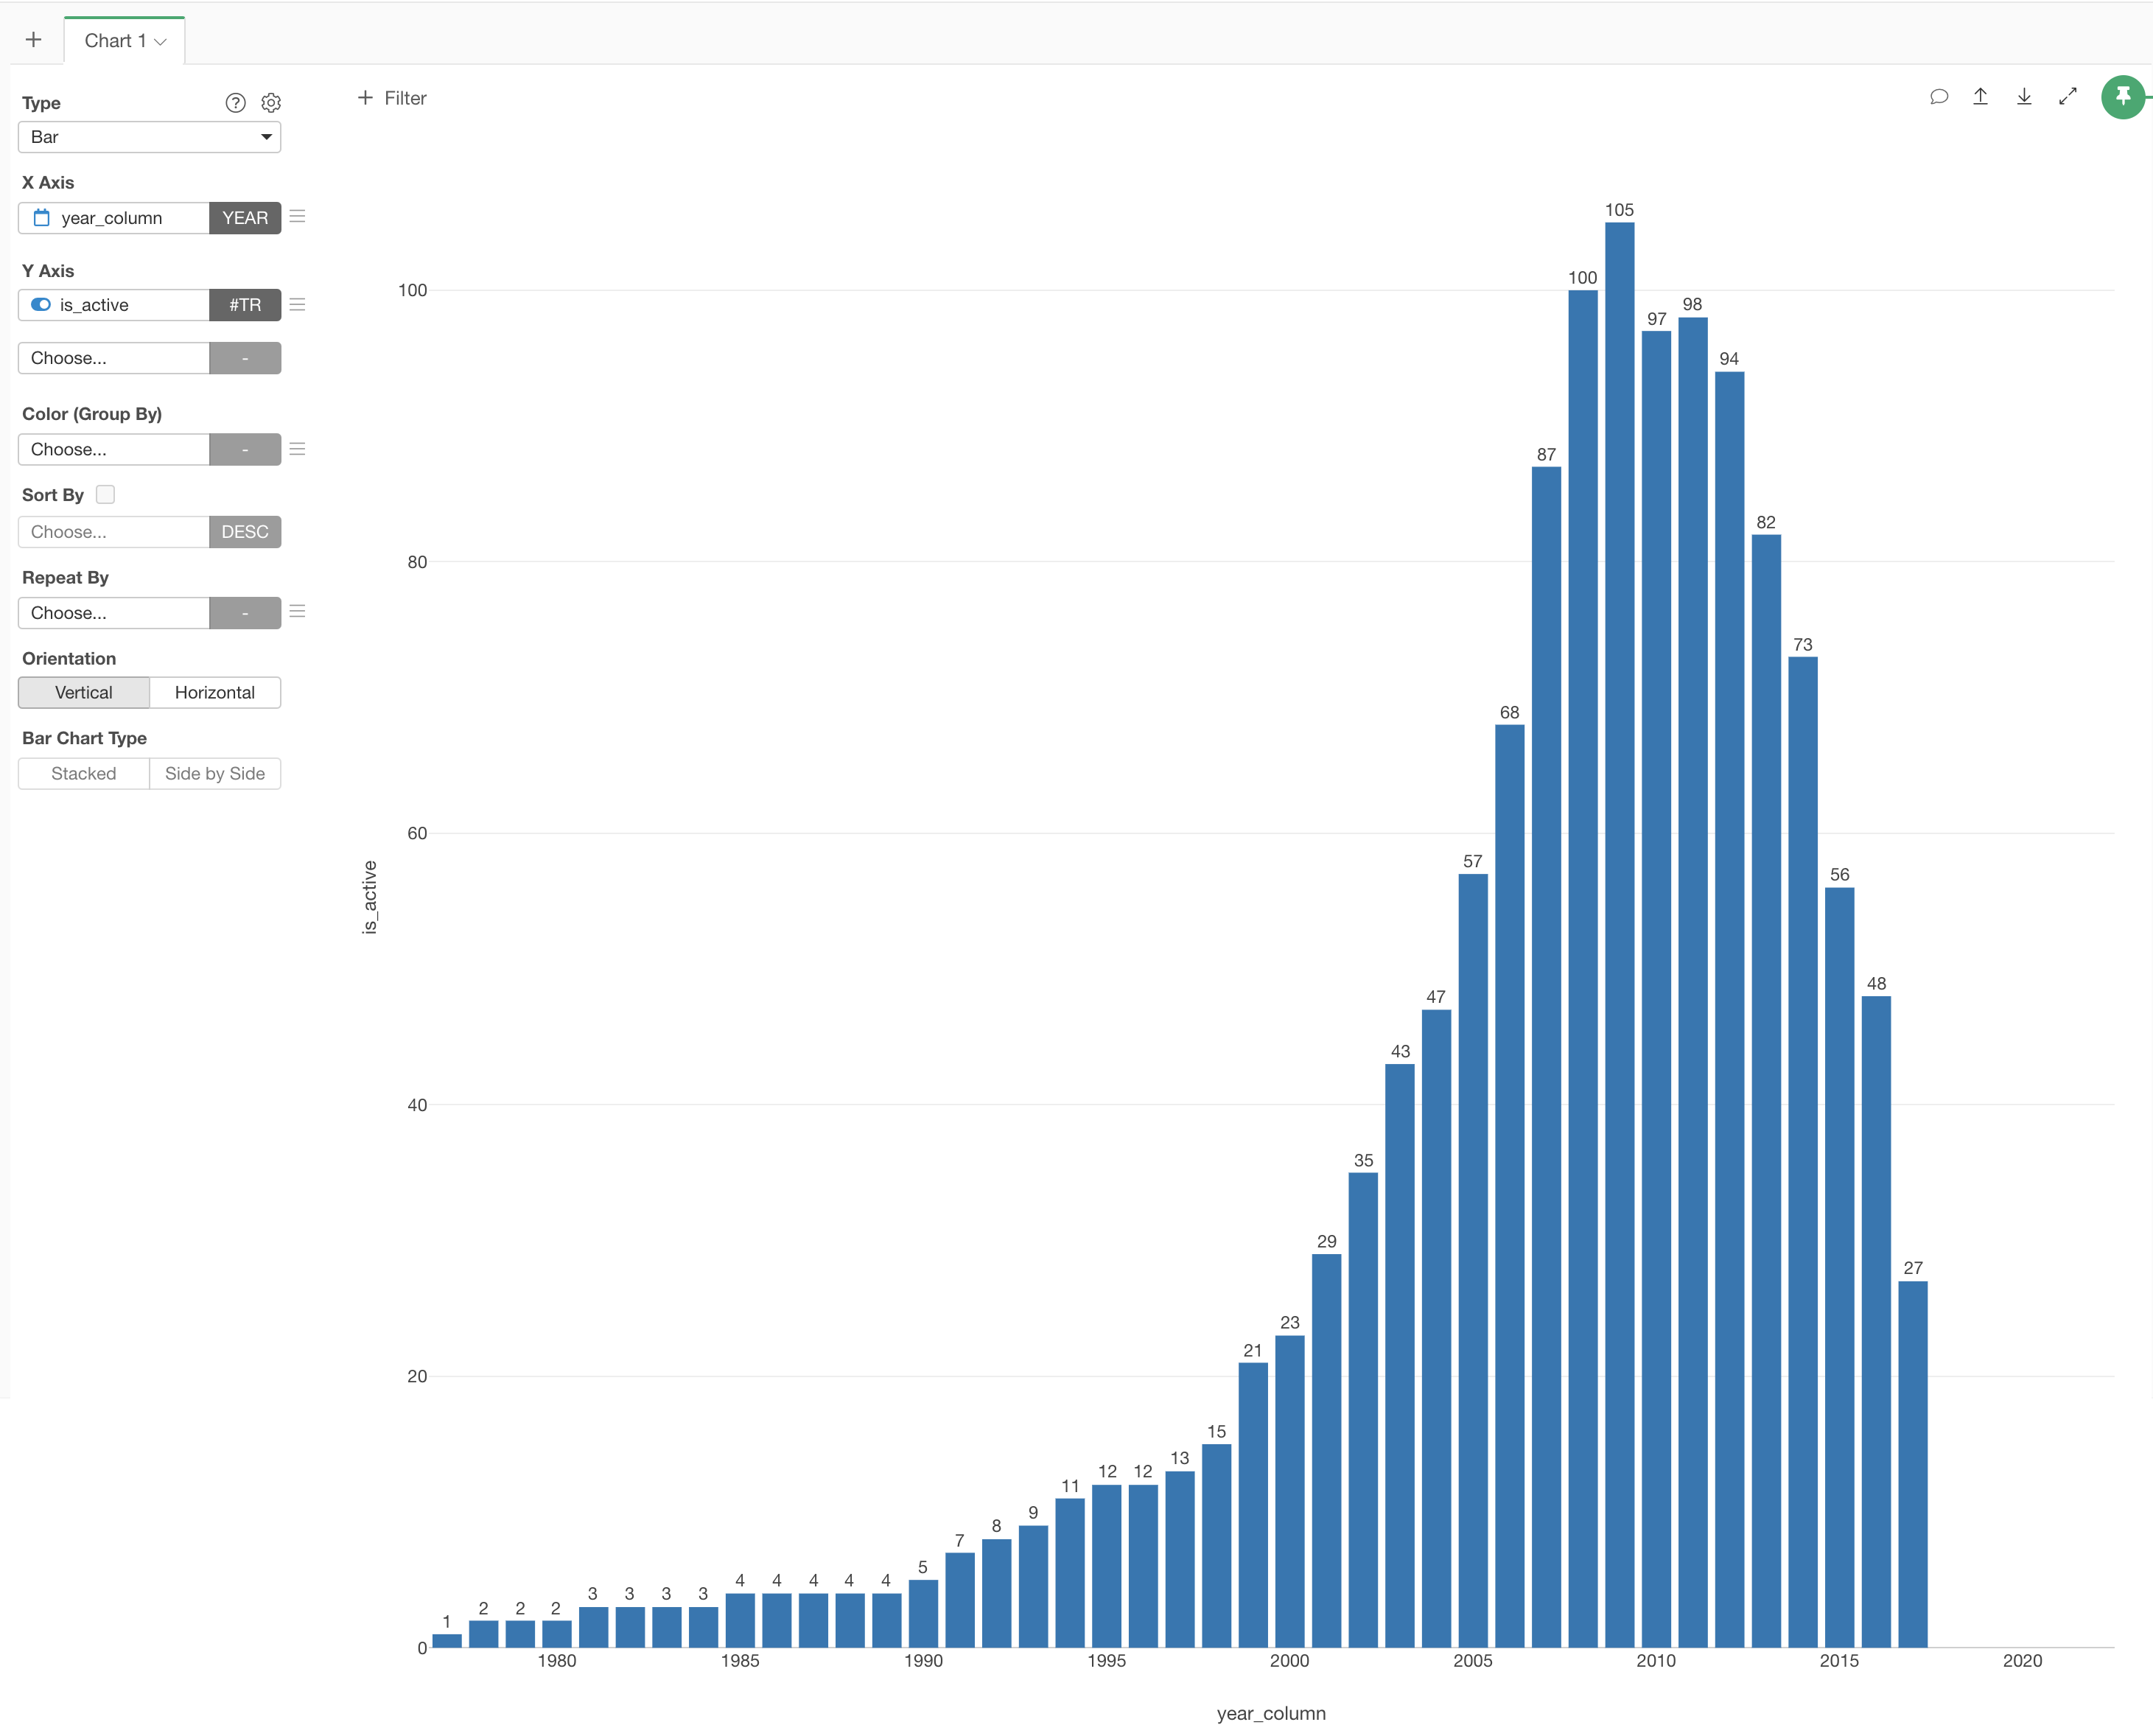
- Create a bar chart and visualize an active event (or active entity) per year.
Thx a lot! This solves it for me.