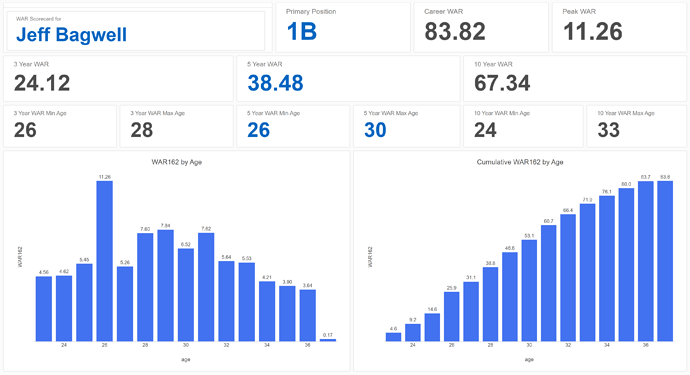
Hi everyone - just want to drop a note for my upcoming baseball-related book where I used Exploratory for almost all the data wrangling and most of the visuals in the book. Expected release date is August 20th, 2025. The subject is WAR (Wins Above Replacement), and the title is The Visual Book of WAR. I’ll have both e-book and hardcover versions available on Amazon, along with additional online resources.
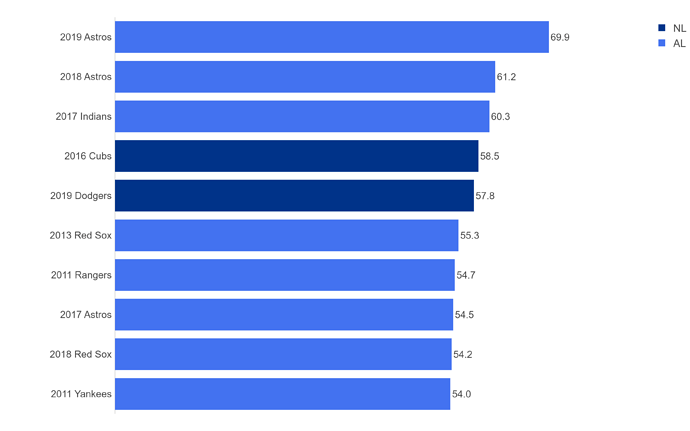
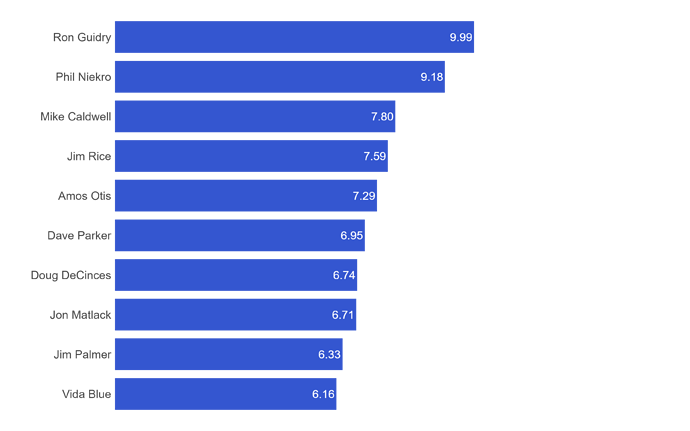
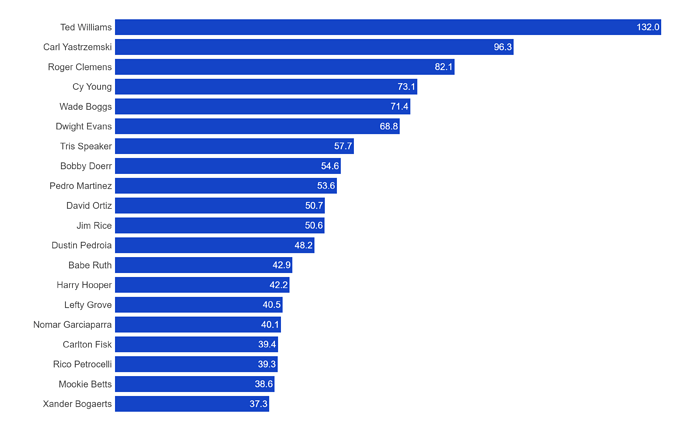
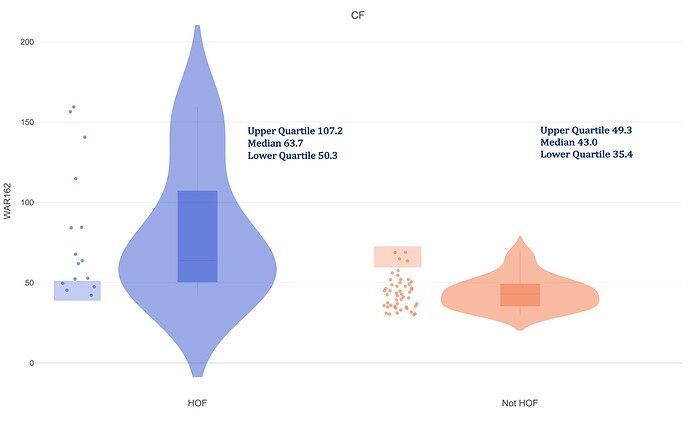
In the process of cover design and PR work before the release date. Here are some example charts from the book:

