As the tutorial suggested we gathered the data and generated a ‘Key column’, but in the market basket analysis we didn’t seem to use the parameter from the key column, could anyone please explain why we need to have the key column generated?
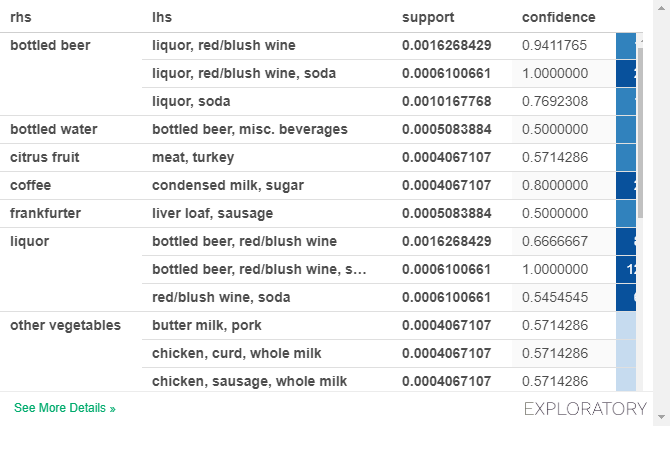
Also, I’m using the Exploratory 6, the UI is very different to the tutorial, it seems the new version basket analysis generates the pivot table directly (but the tutorial showed step by step guide). How could I expand the auto generated pivot table please? It currently only provides 9 rows
I found the tutorials extremely useful however most screenshots were made in the older version of Exploratory, an update of the tutorial materials (not just for market basket analysis) are much appreciated.
As the tutorial suggested we gathered the data and generated a ‘Key column’, but in the market basket analysis we didn’t seem to use the parameter from the key column, could anyone please explain why we need to have the key column generated?
The Key column is not required for market basket analysis.In the apriori function of this arles package, the columns needed are “ID to identify the shopping cart” and “product name”.
Indeed, the Key column created in this tutorial is not needed for market basket analysis, but is a “byproduct” of the apriori function’s transformation of the data structure (Wide to Long) to use the apriori function.
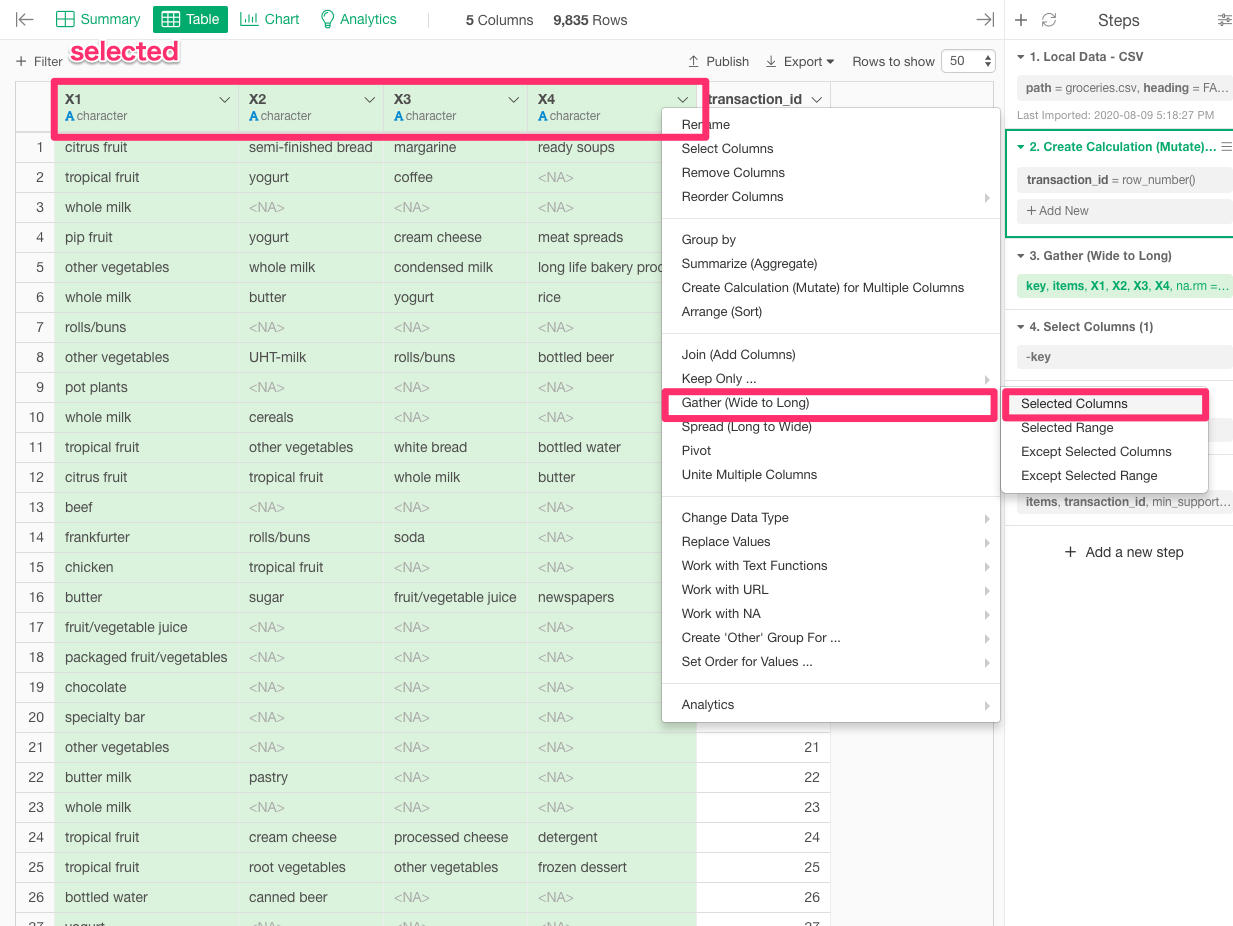
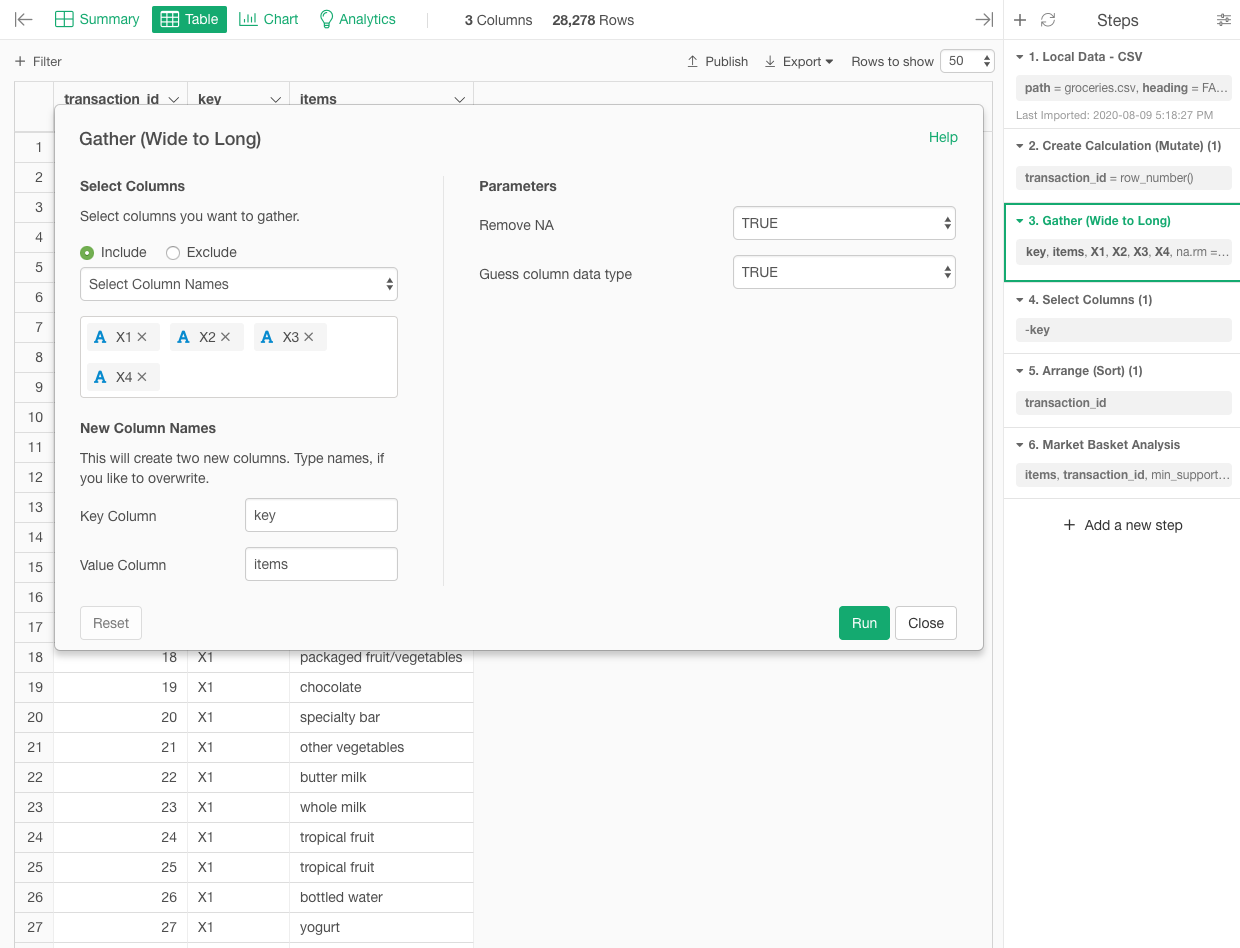
In Explortory, the gather function is used to convert the data structure (Wide to Long). And in brief, this gather function creates a Key column as a byproduct.
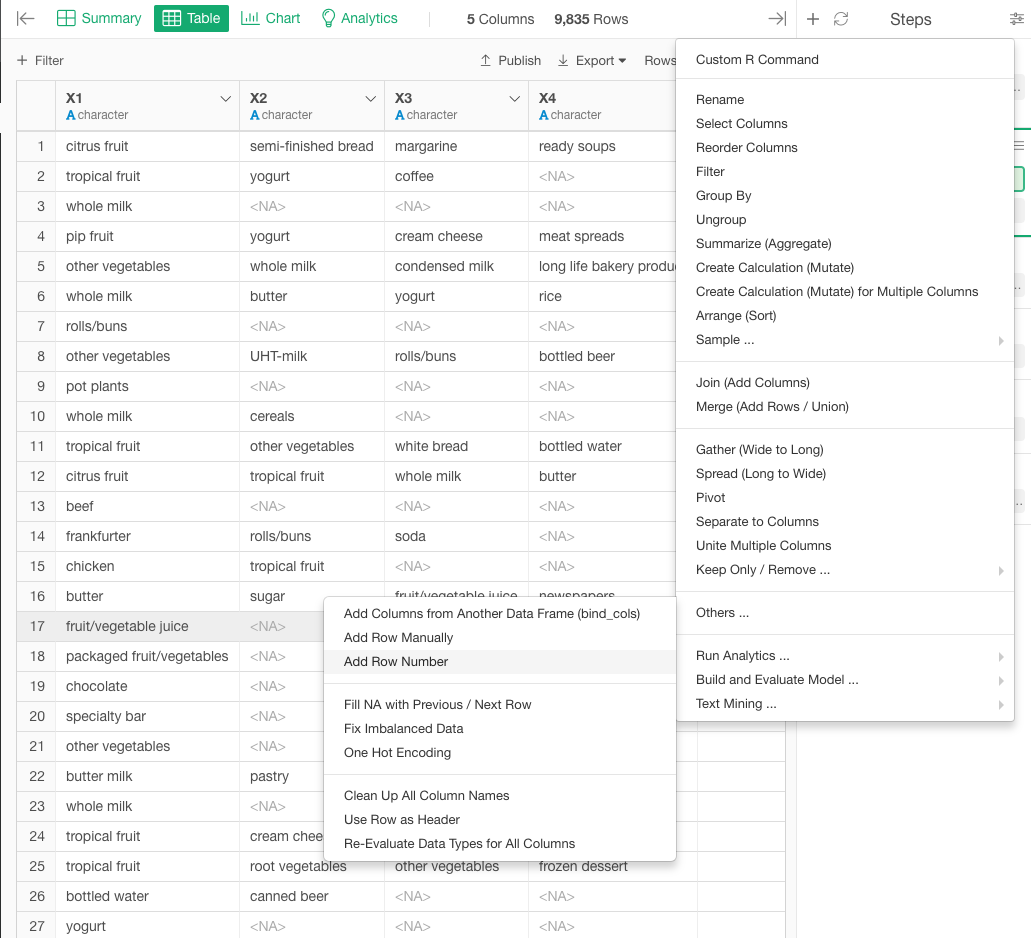
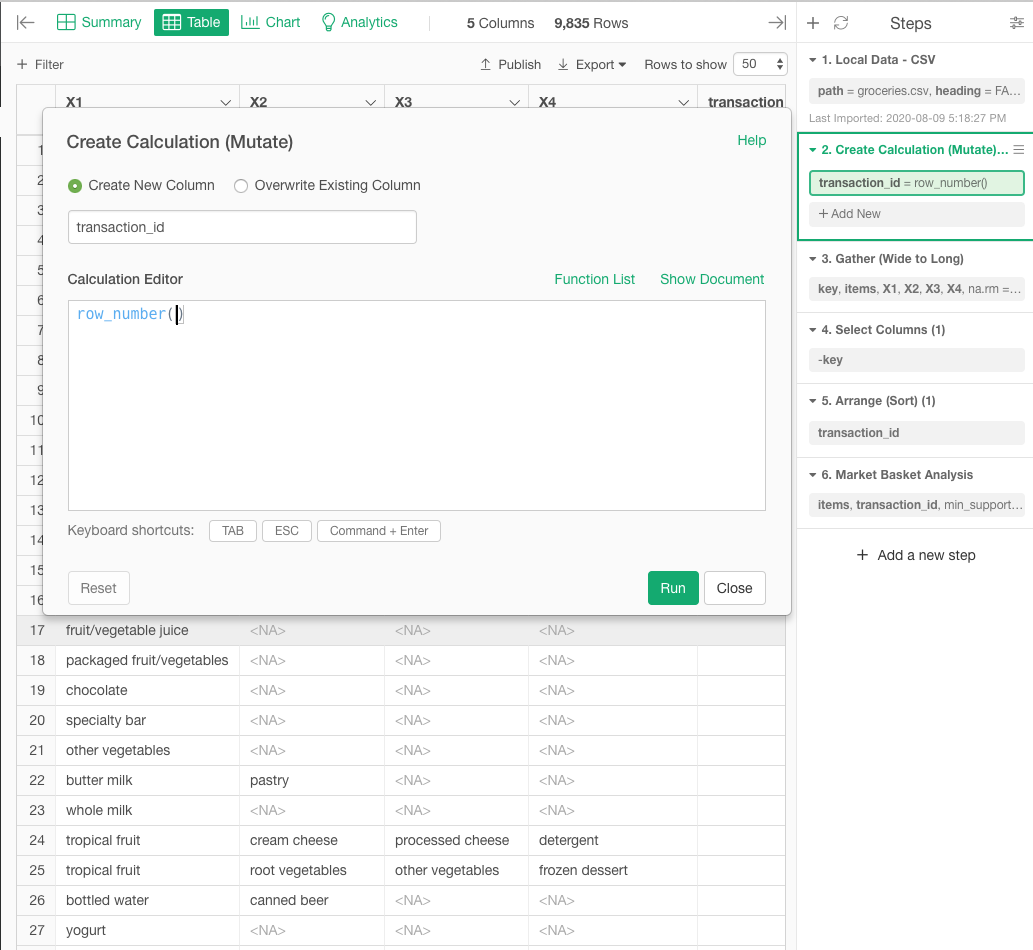
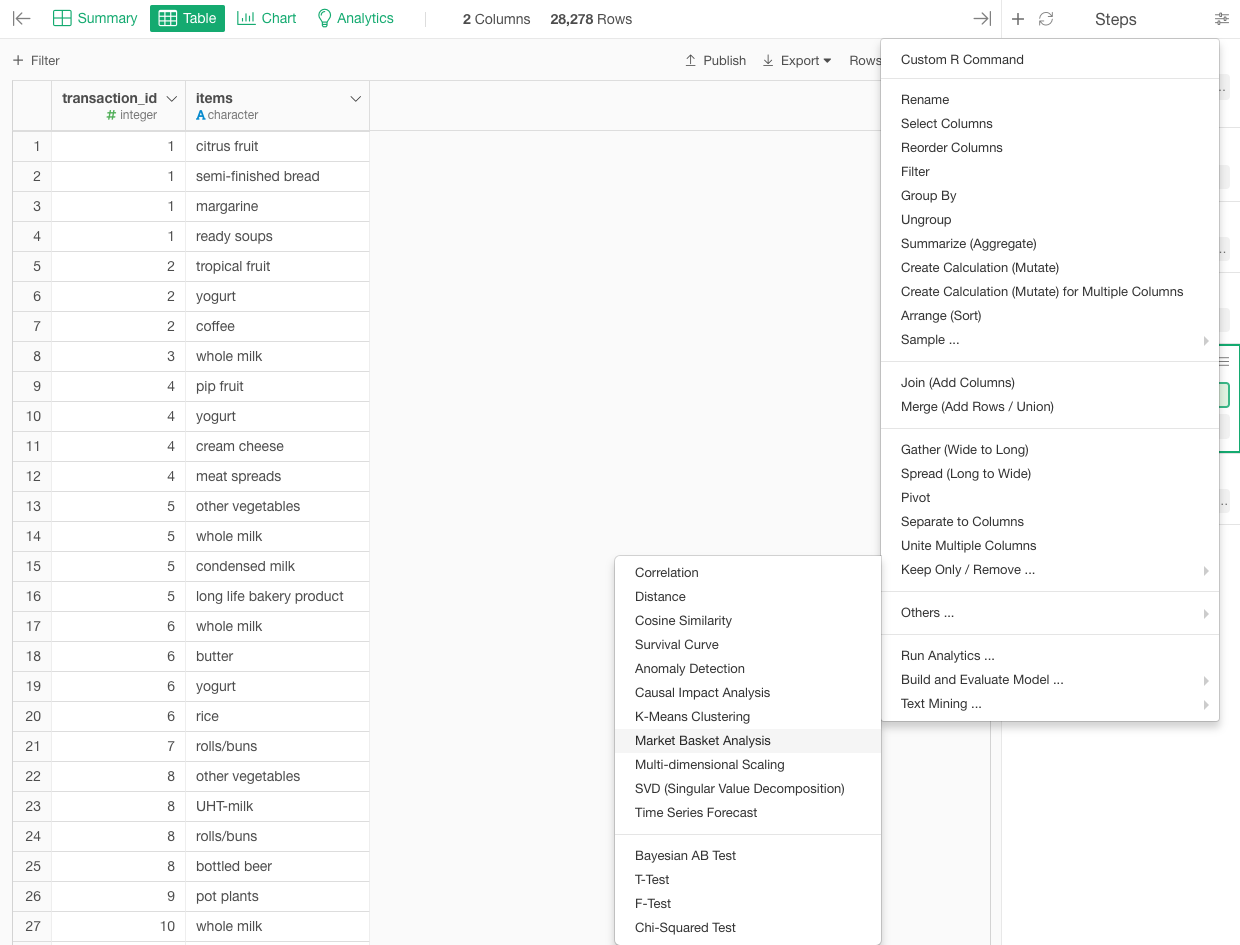
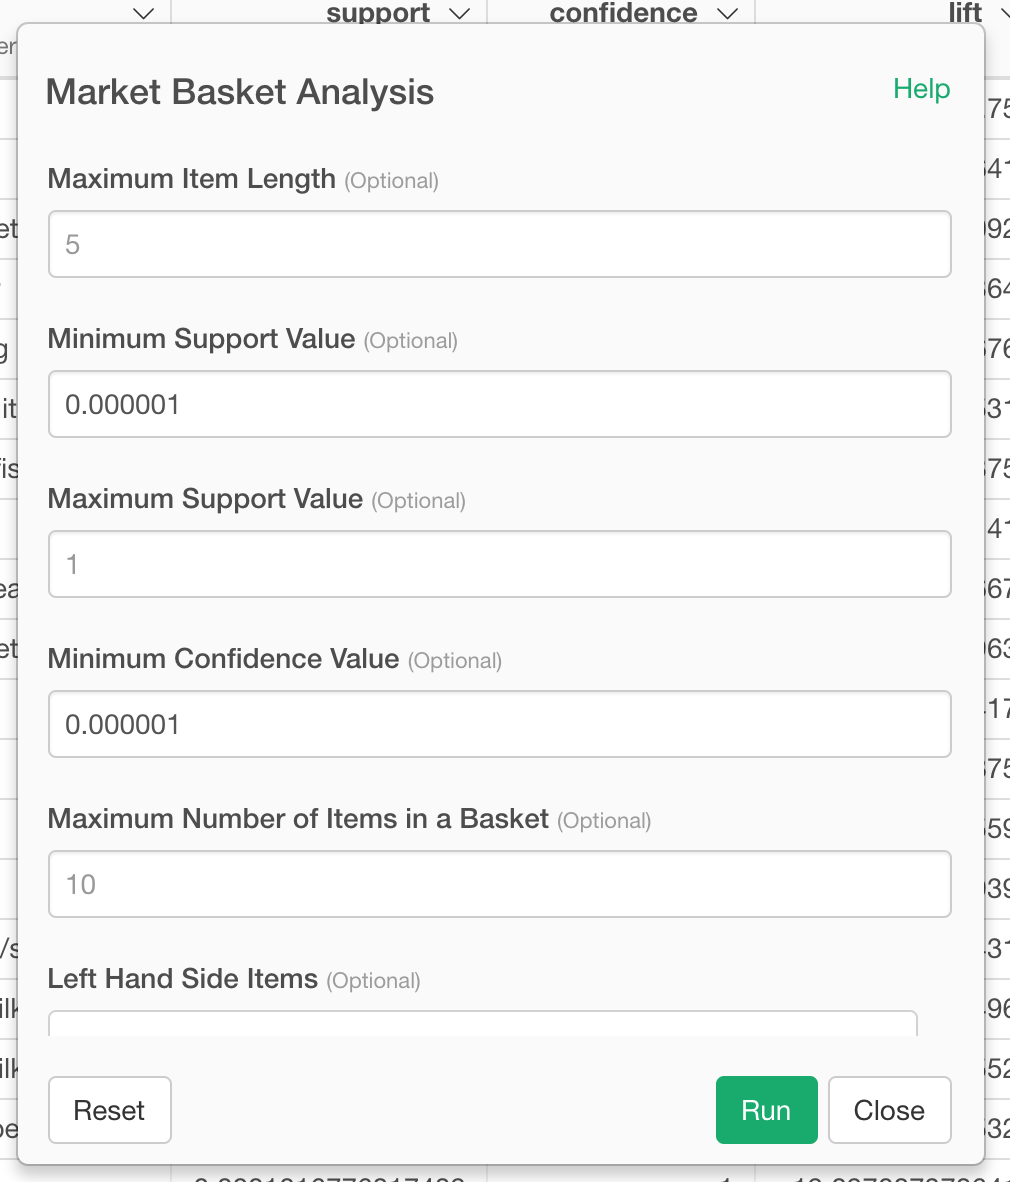
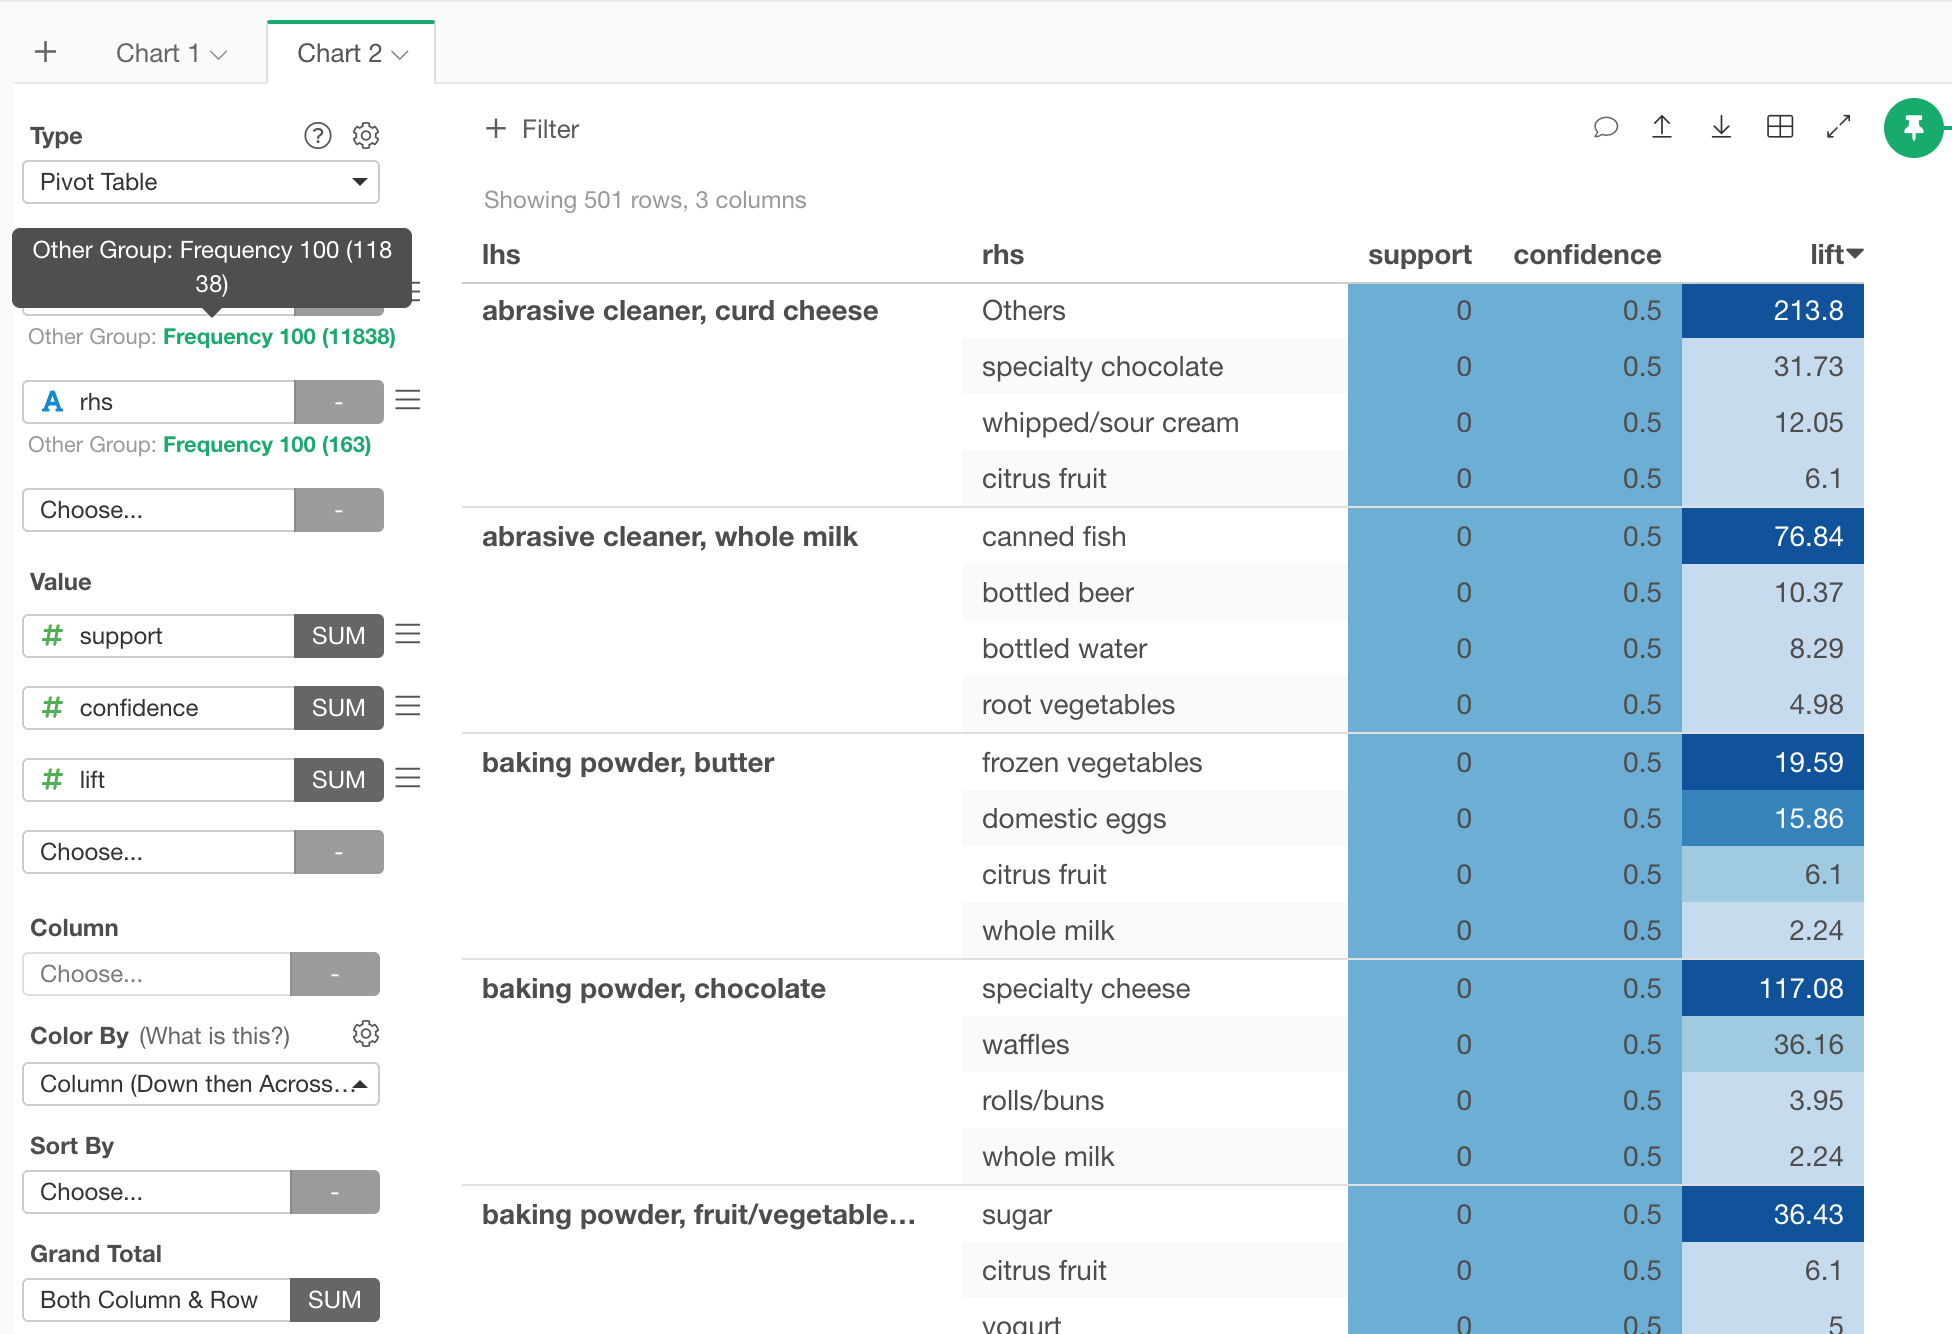
I have reproduced this tutorial in the latest Explraotory 6.
but it does not display full list (only 10 rows), unlike the tutorial:
Is there any method to show the full table instead a table with 10 rows?
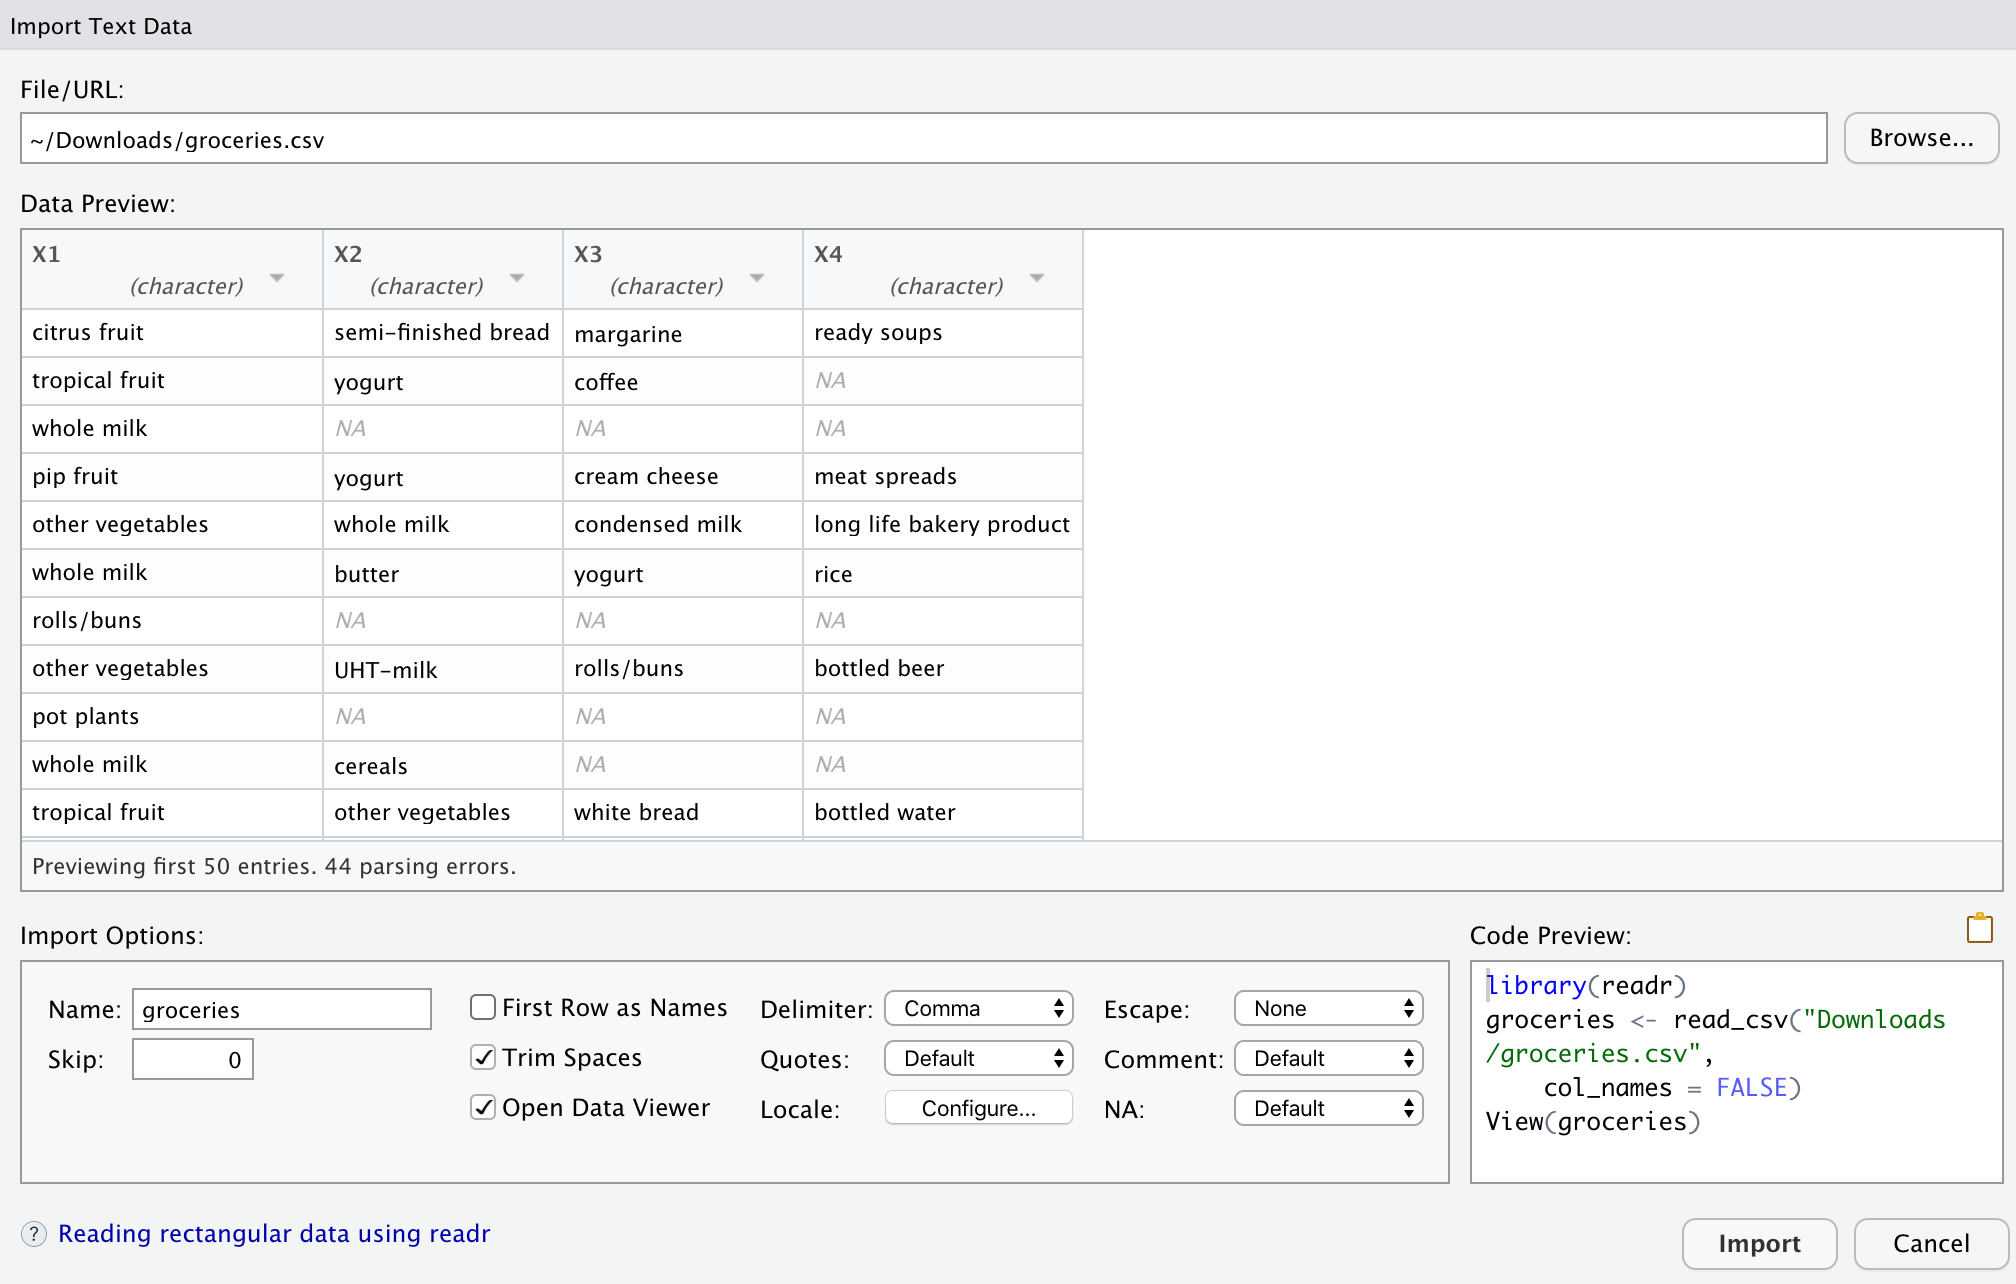
I have another question, please, when I replicate the tutorial: the original dataset (groceries) has more than 4 columns according to the csv file, but it seems when I load it to Exploratory, only 4 columns were captured, am I reading it wrong please?
There are two possibilities for limiting the number of records in a table.
The first is if it is limited by the parameters of the association analysis. If you set it lower than the number in the tutorial, you will see a lot of combinations (which will take longer to calculate).
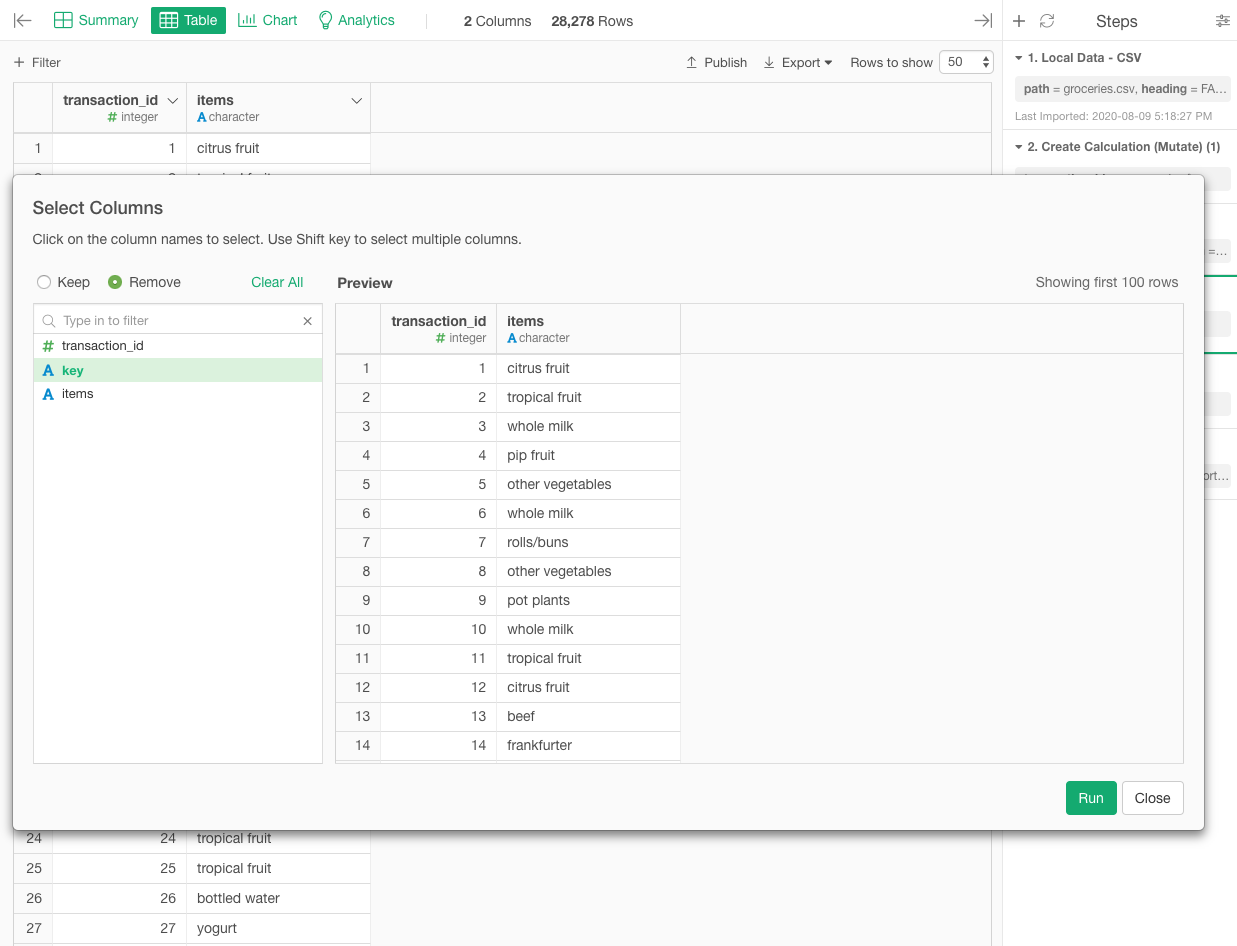
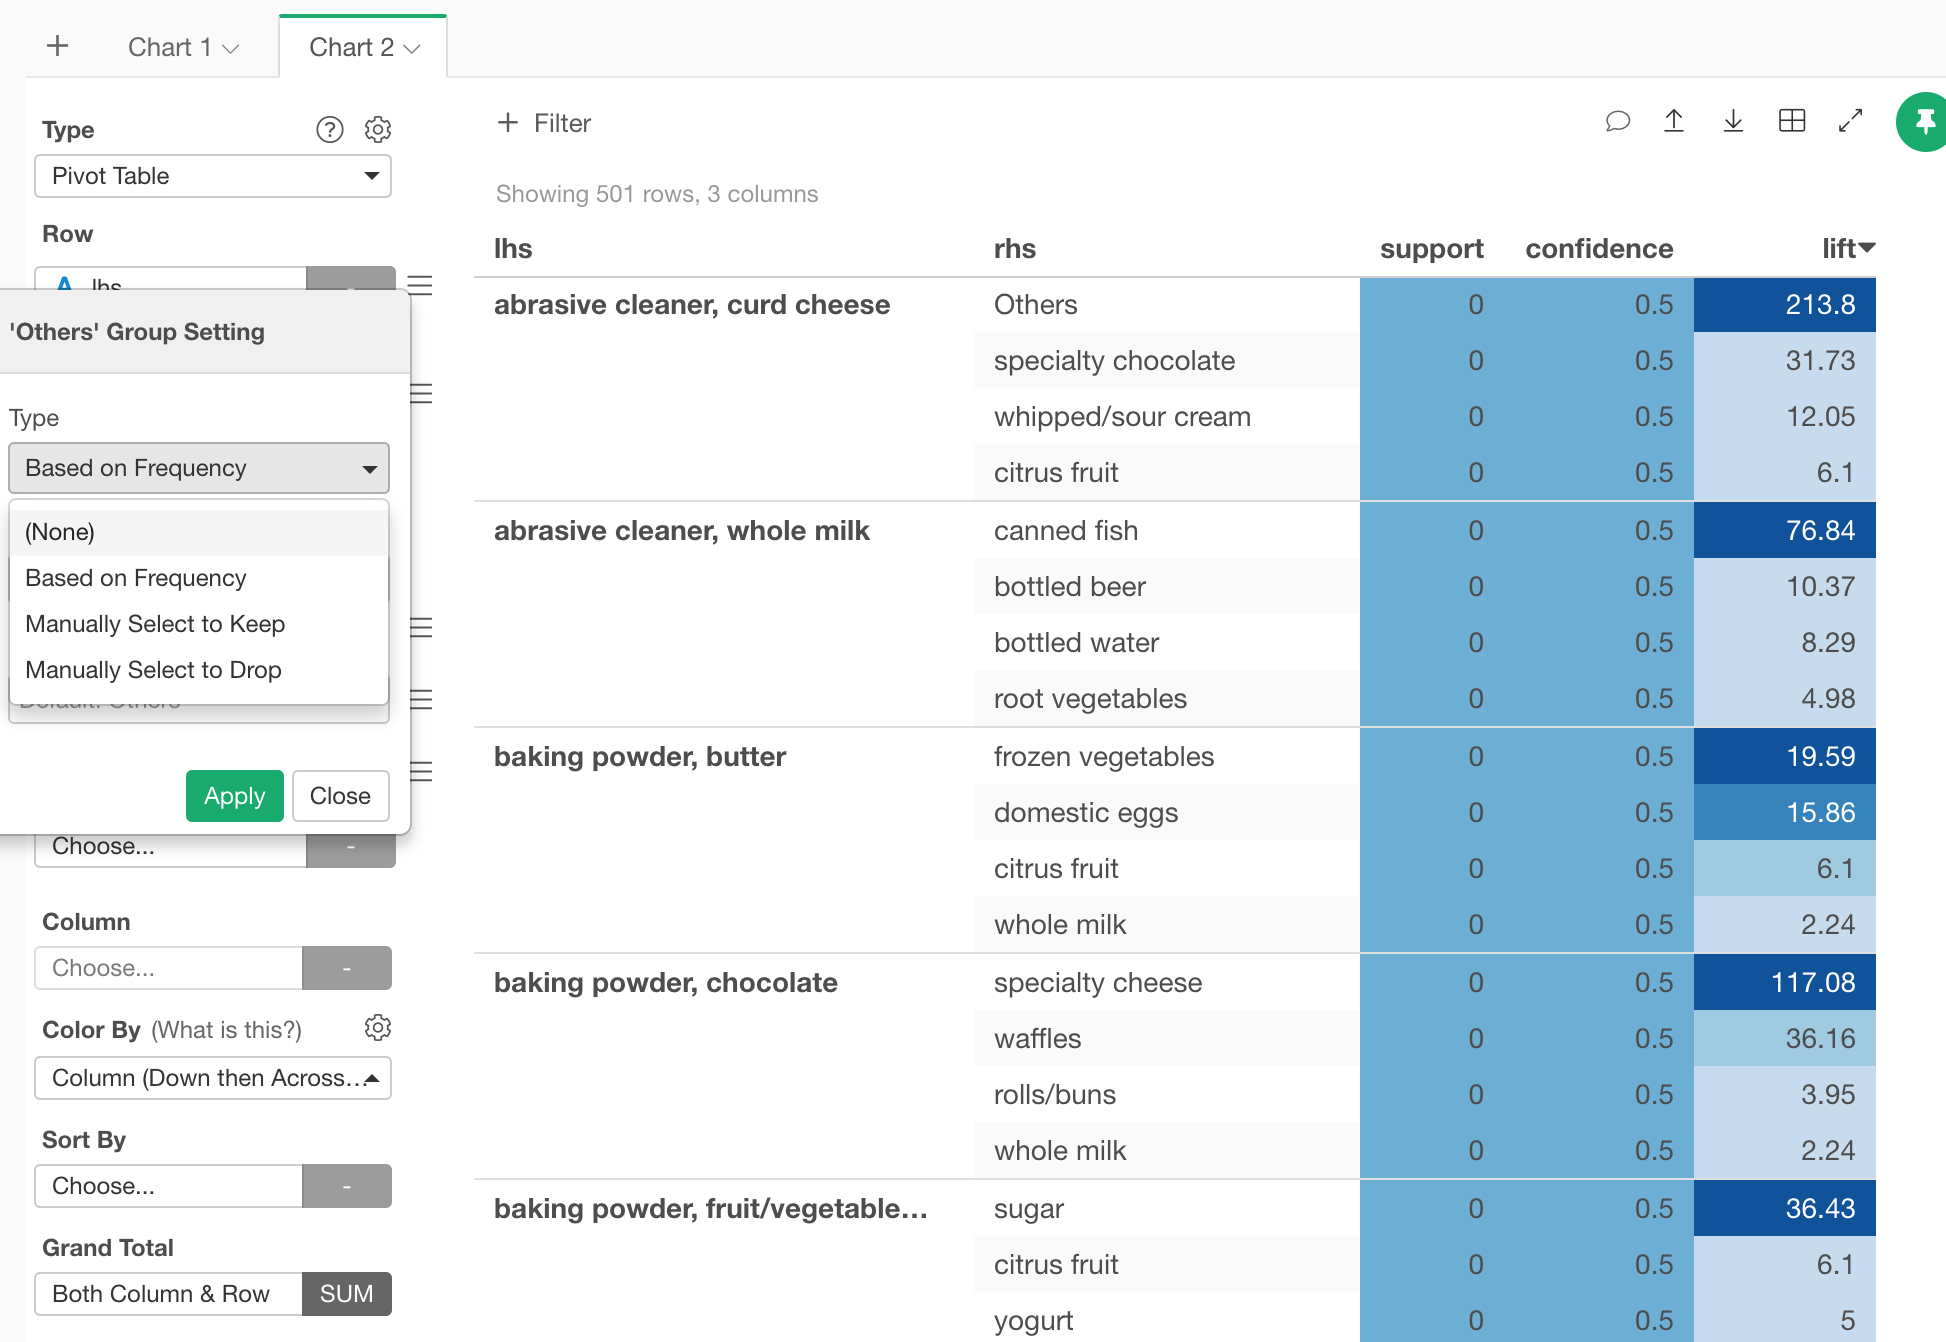
The second is when it is limited by the pivot table. By default, categorical variables are display-restricted, so if you set them lower than the number in the tutorial, you will see many combinations (which will take longer to calculate). If you remove it, you can display all the results of the calculation.
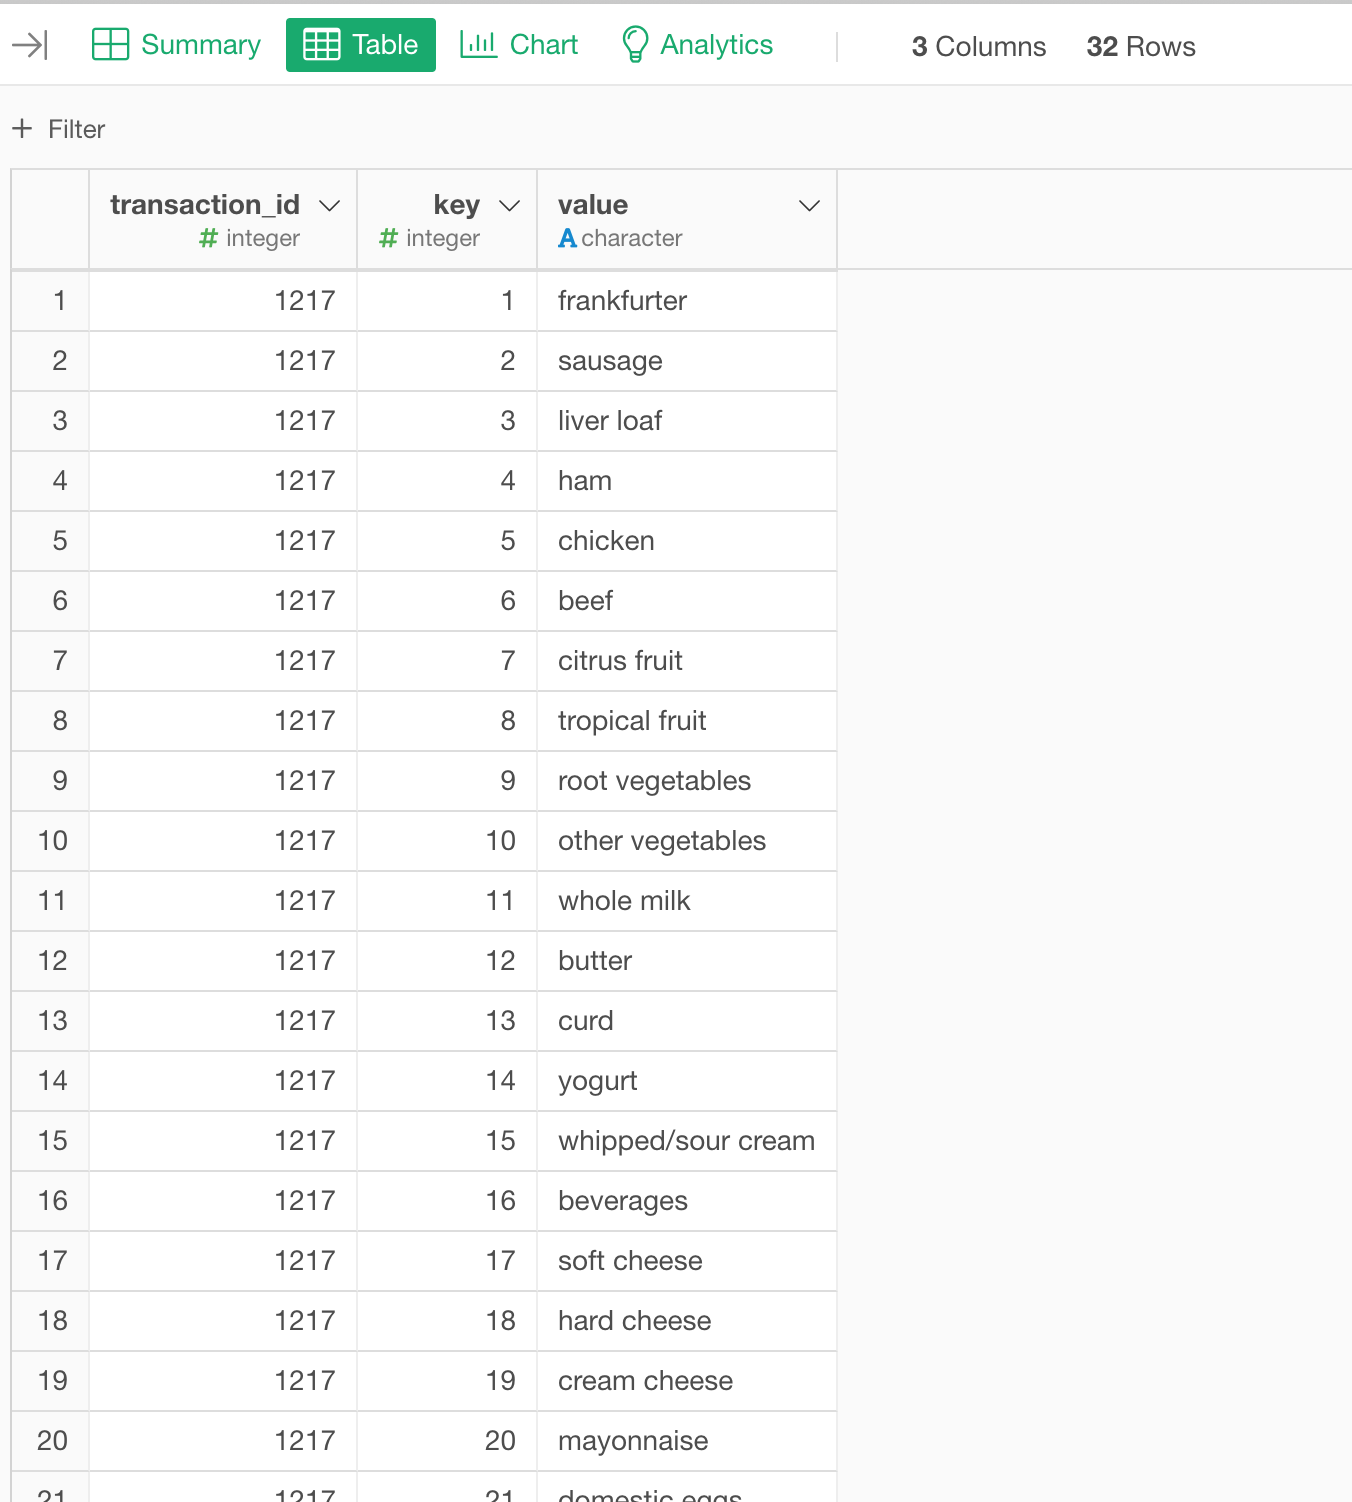
I have reviewed the csv data provided in the tutorial. It’s definitely more than 4 columns, as you can see in the image. I hadn’t noticed that.
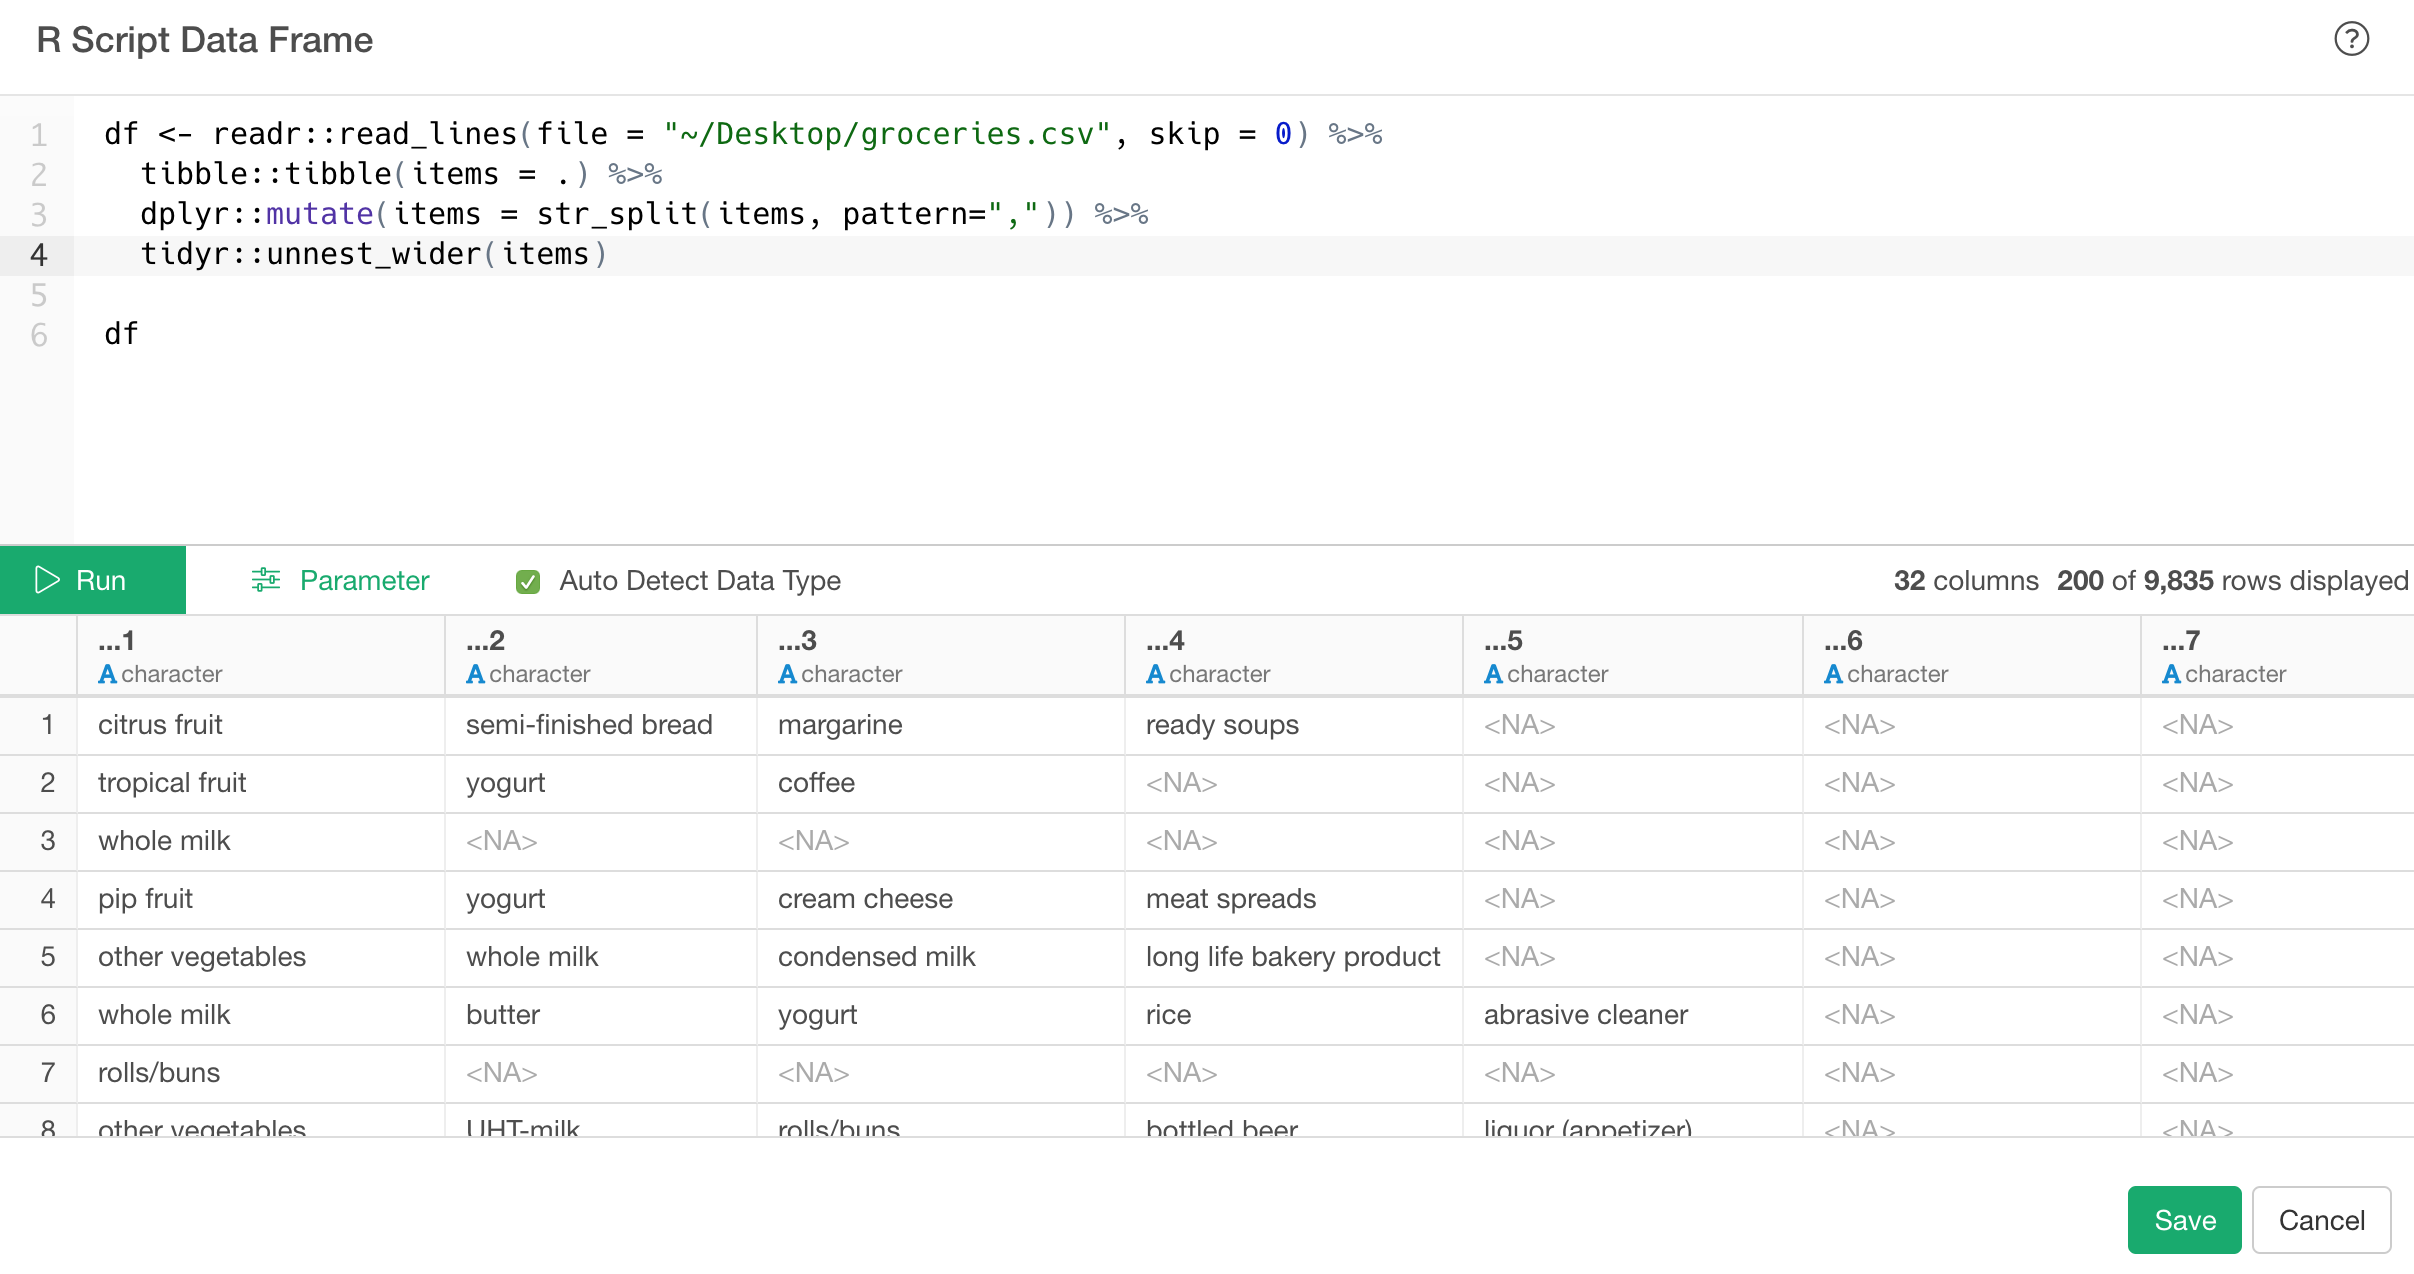
To validate, I read the raw data column names with sequential numbers. The data in row 1217 seems to contain 32 products, so there should be 32 columns in the raw data csv.
The workaround is to load the column names with sequential numbers, but that’s not a practical method, so I’ll let you know if I know of another good way to do it. Sorry…
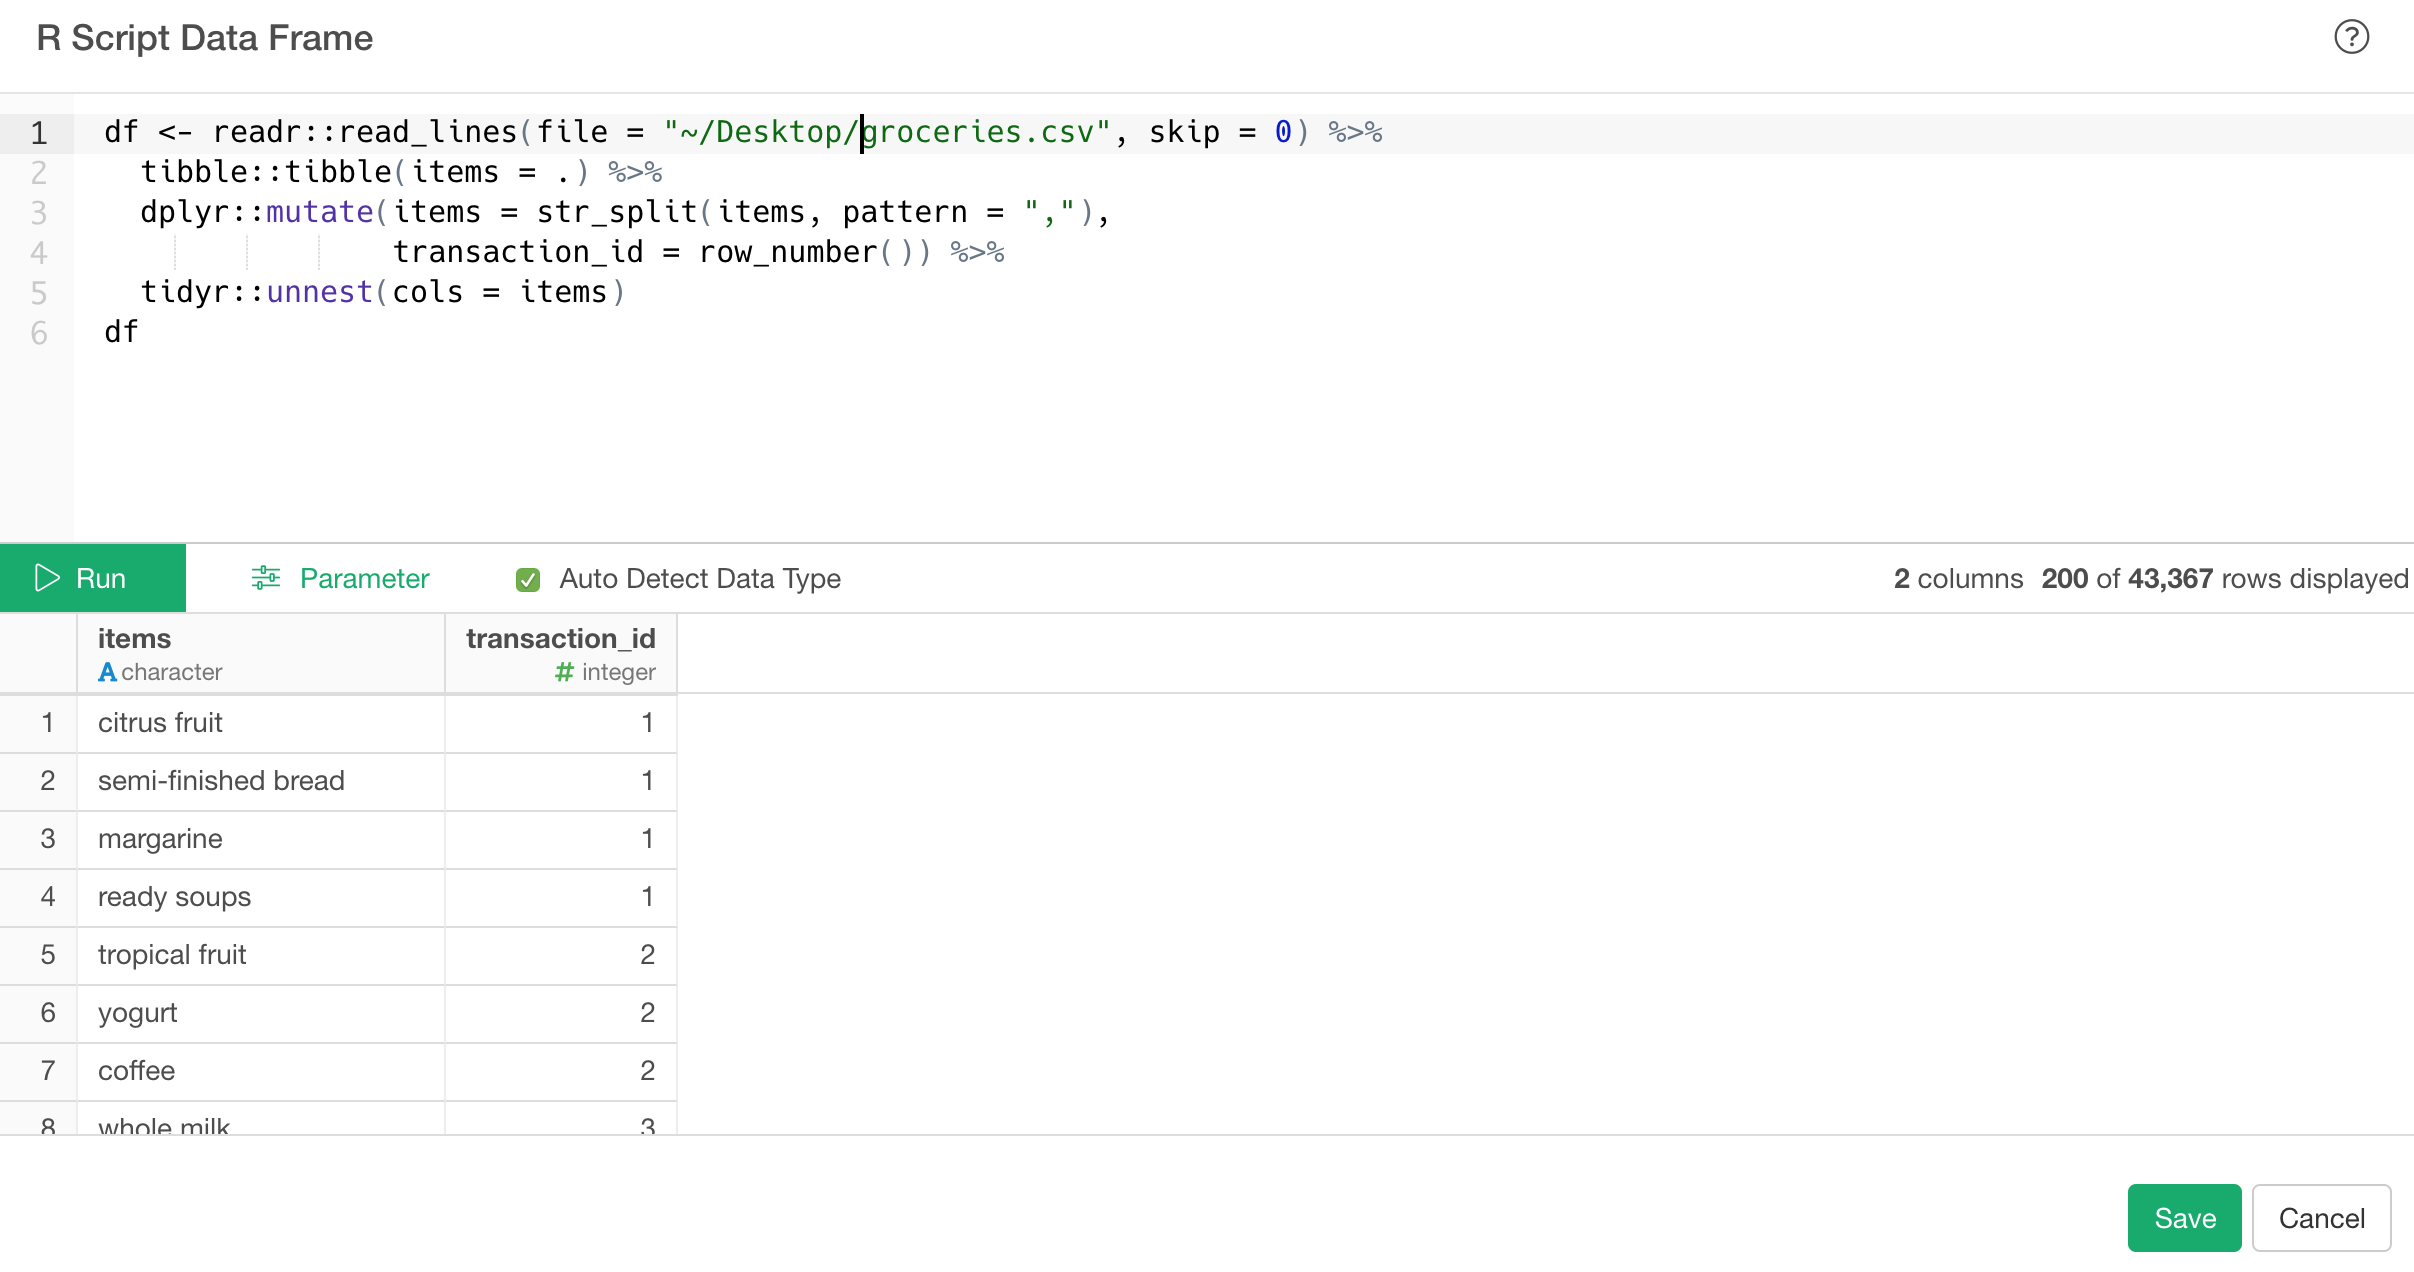
I think this problem is probably caused by the lack of column names and therefore the problem of inferring the number of columns from the data.
As far as I know, I don’t know of any way to resolve the problem by setting the read options.
Therefore, I recommend loading the csv data with an R script as shown below.