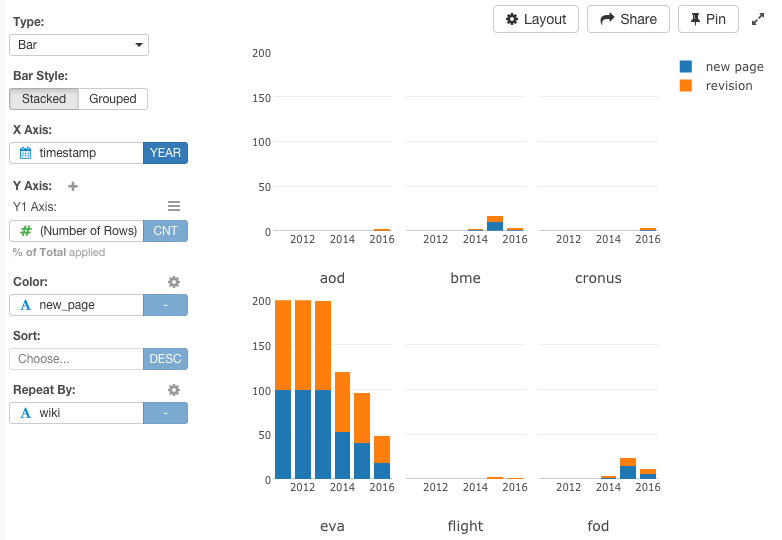
I’m trying to show a progression over time of two values as represented by % of Total, but faceted.
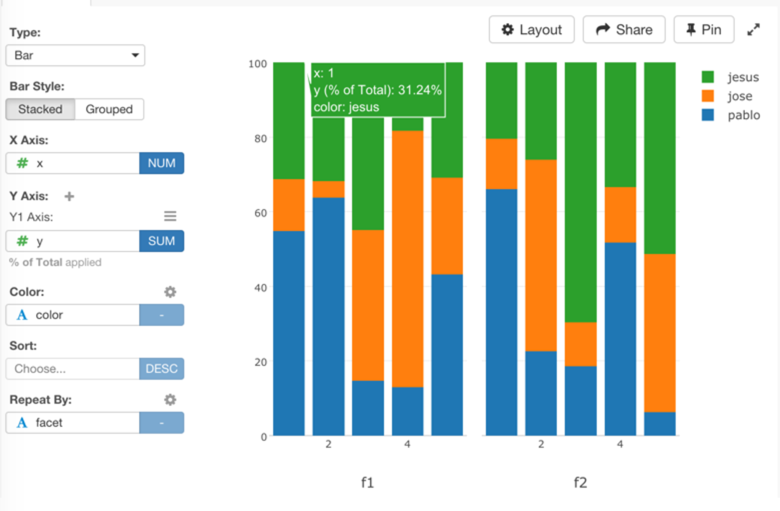
As you can see in my example, I’m not getting what I had hoped to see. Maybe this isn’t possible (or a good idea), so please let me know if that’s the case. But if I don’t use the facet feature, the plot looks like I’d expect with bars all filling 100% height and the colors splitting based on each year’s values (as a % of the whole).