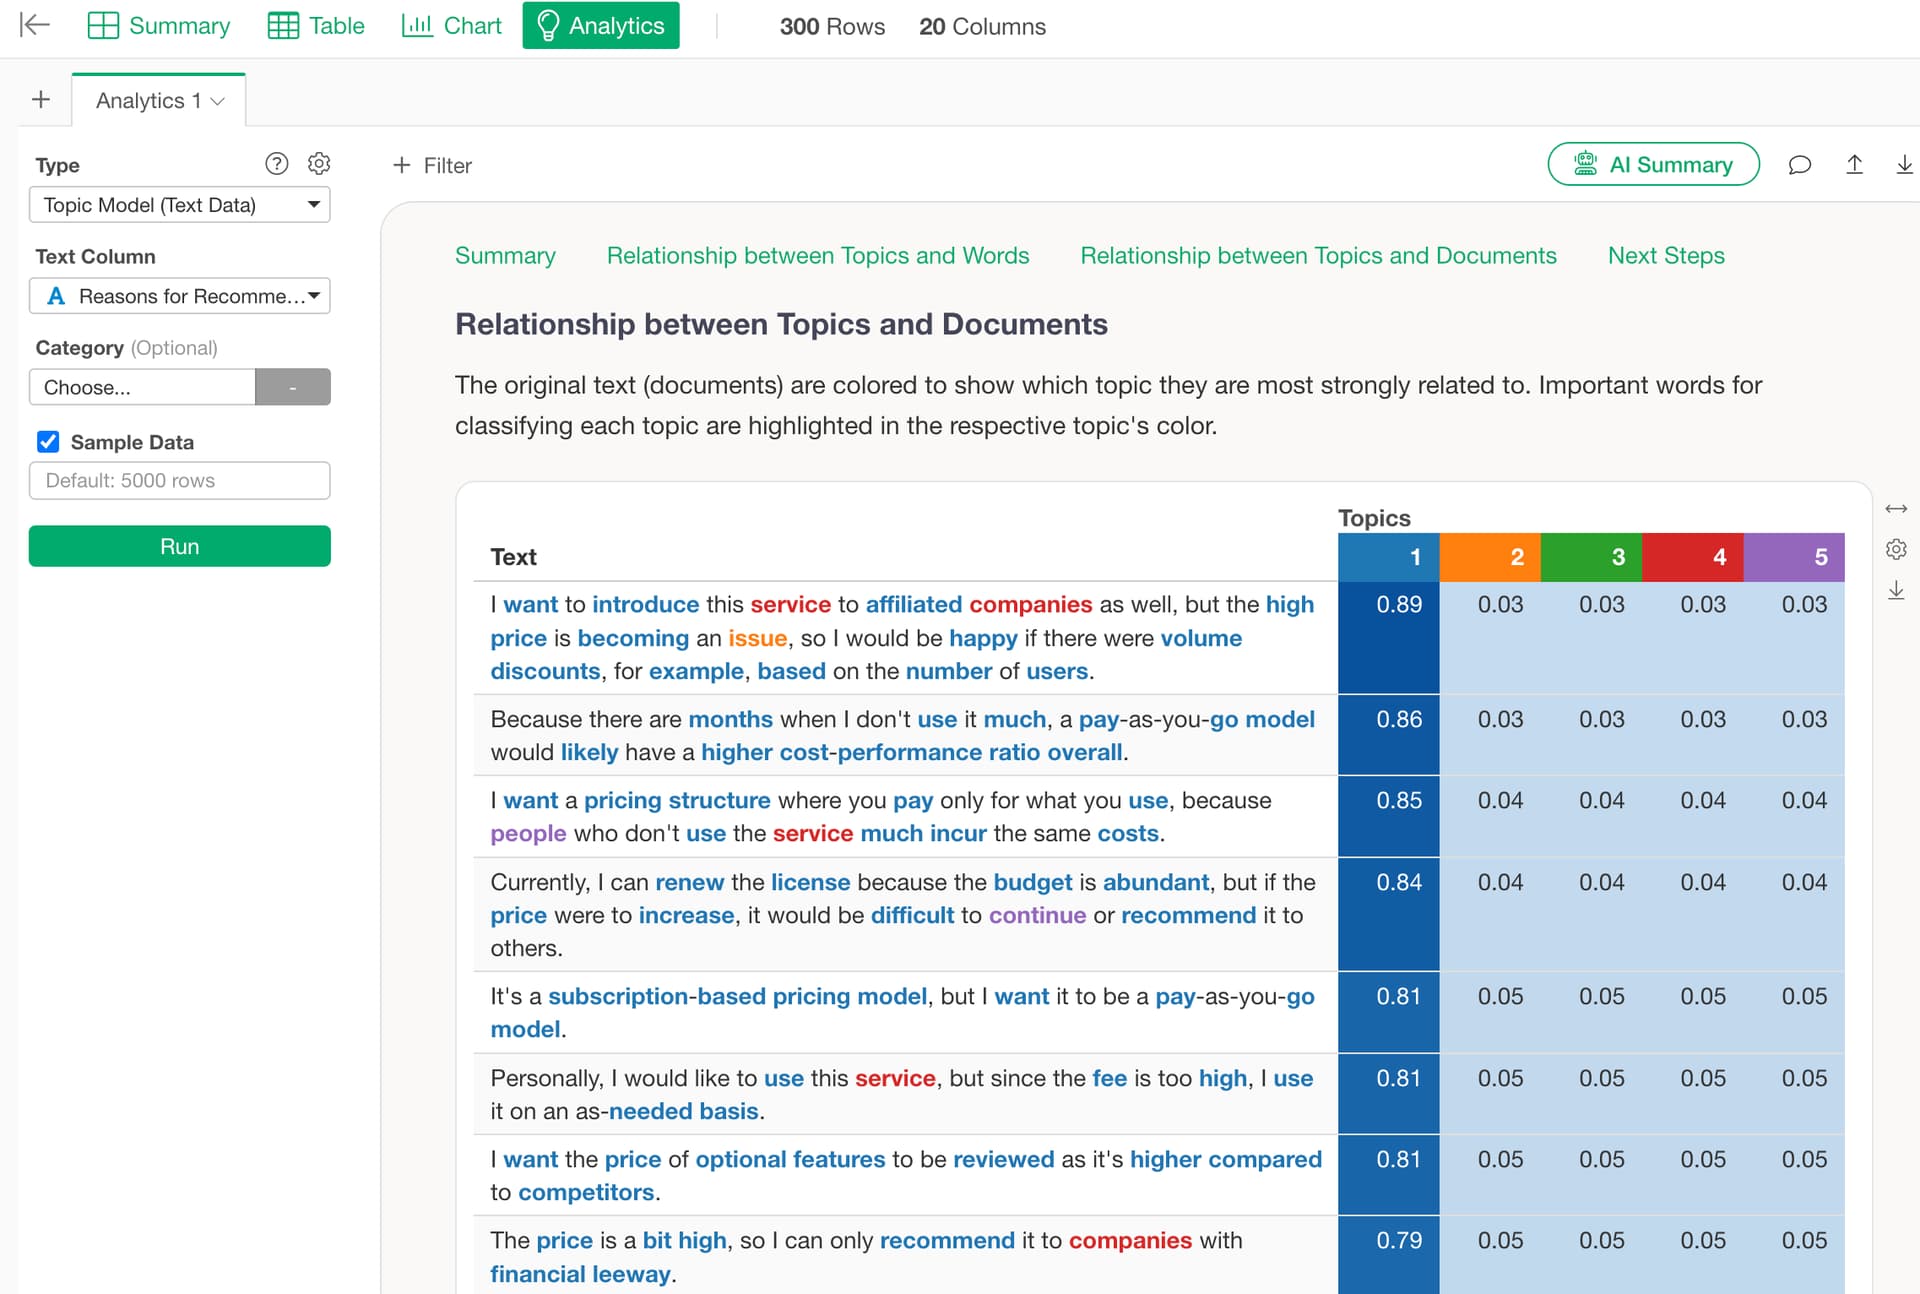
When charts are created in chart view, pivot tables, aggregate tables, or analytics in analytics view, table format charts may be output.
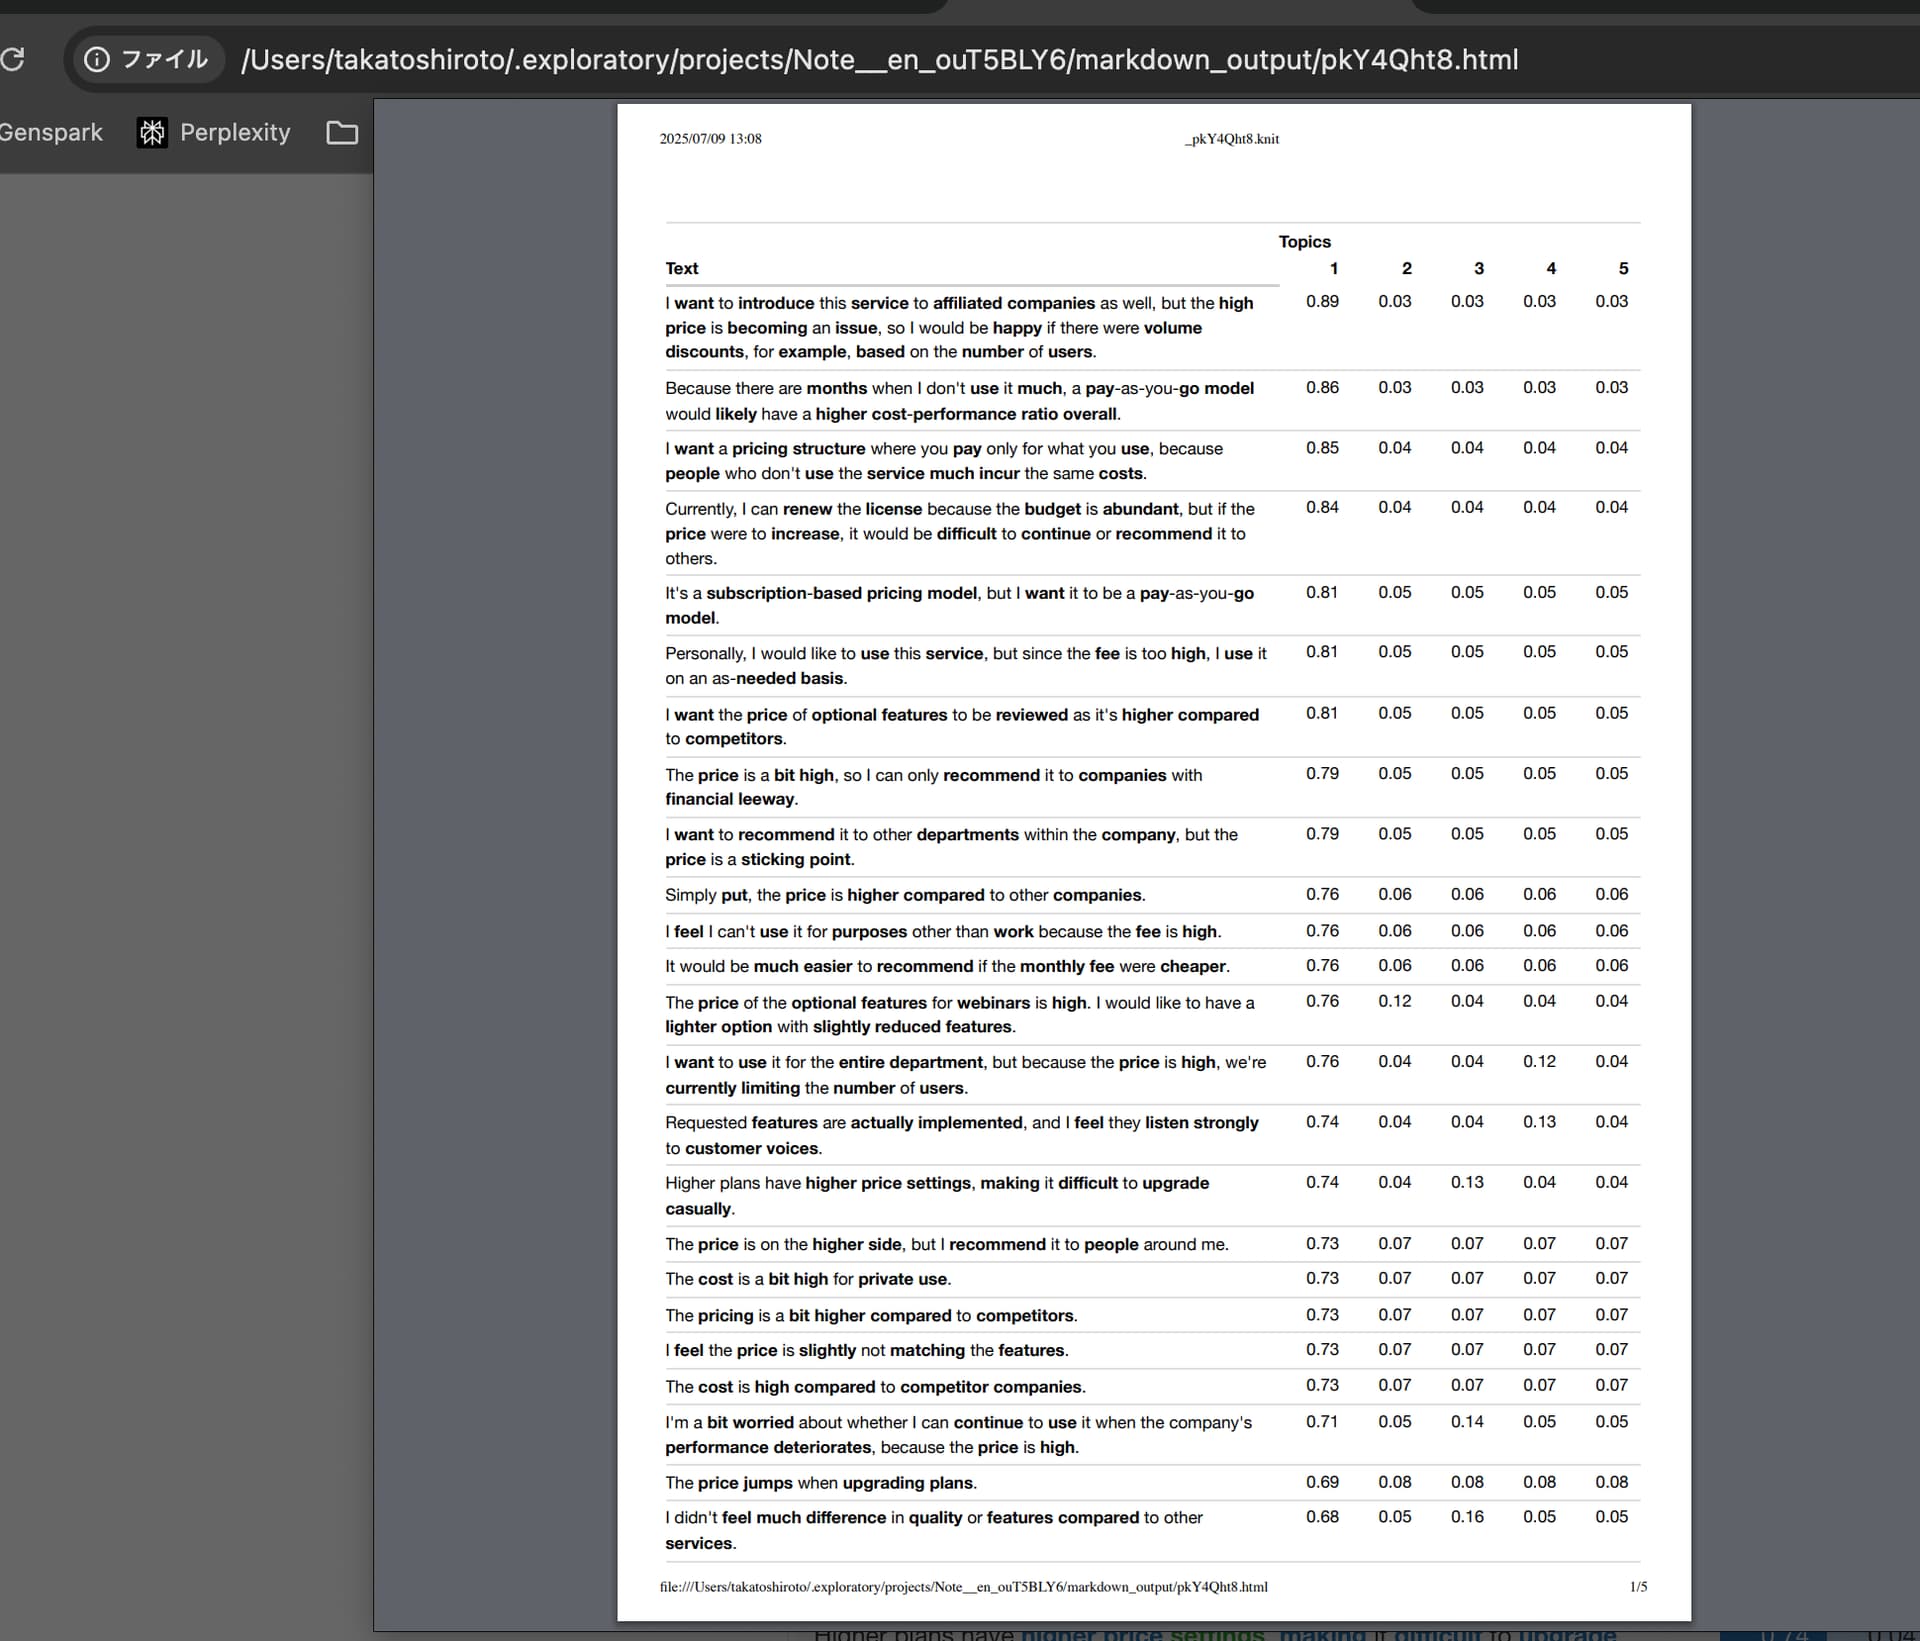
The following is a table showing the topic probability for each sentence when executing a topic model, and I want to convert this table to PDF.
In this case, the note function can solve this issue.
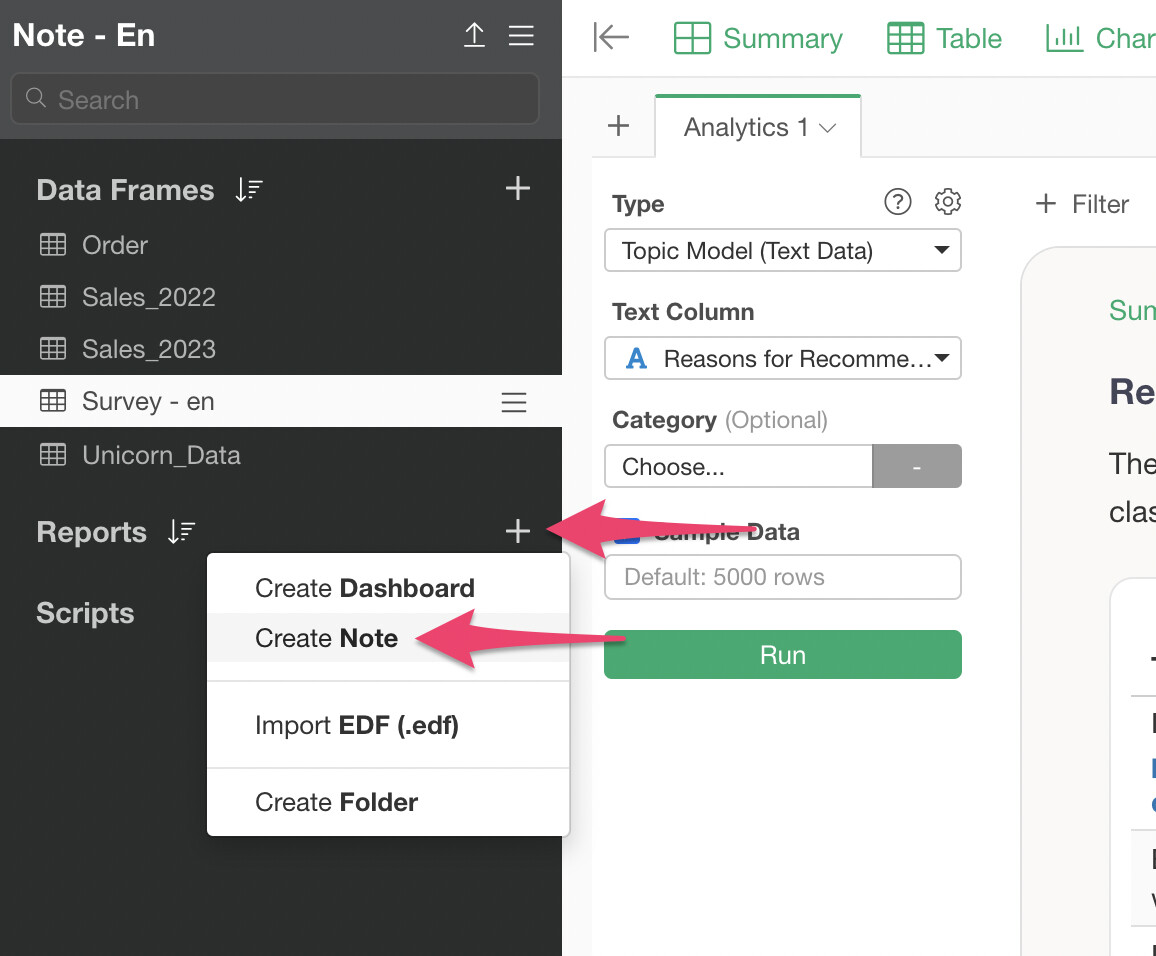
Click “Create Note” from the plus button in the report.
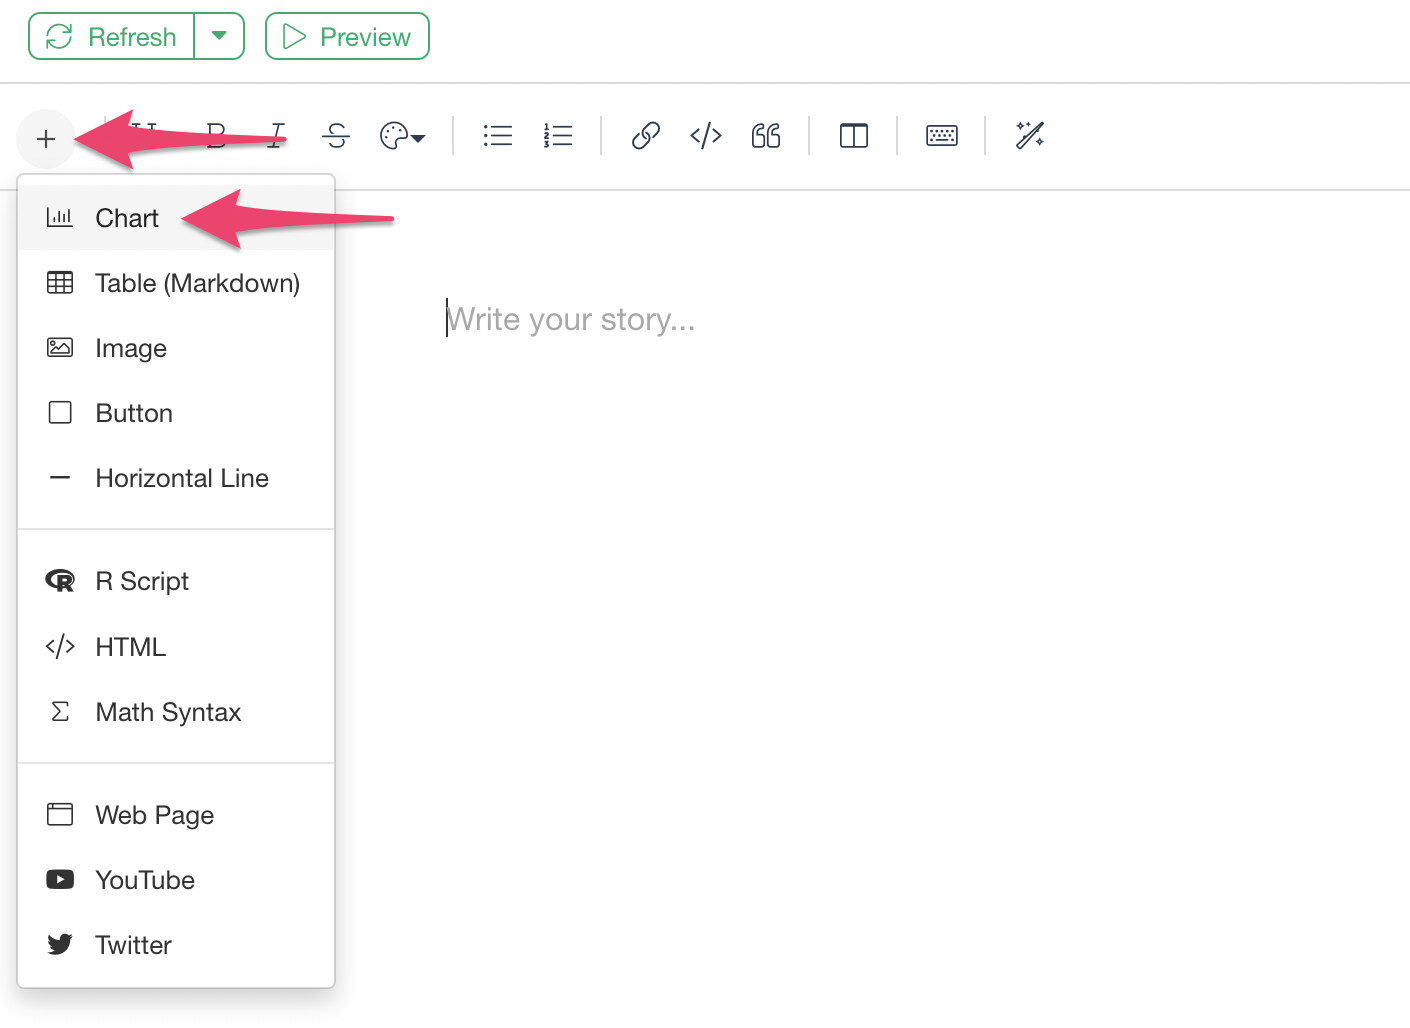
Select “Chart” from the plus button in the upper left and add any table chart.
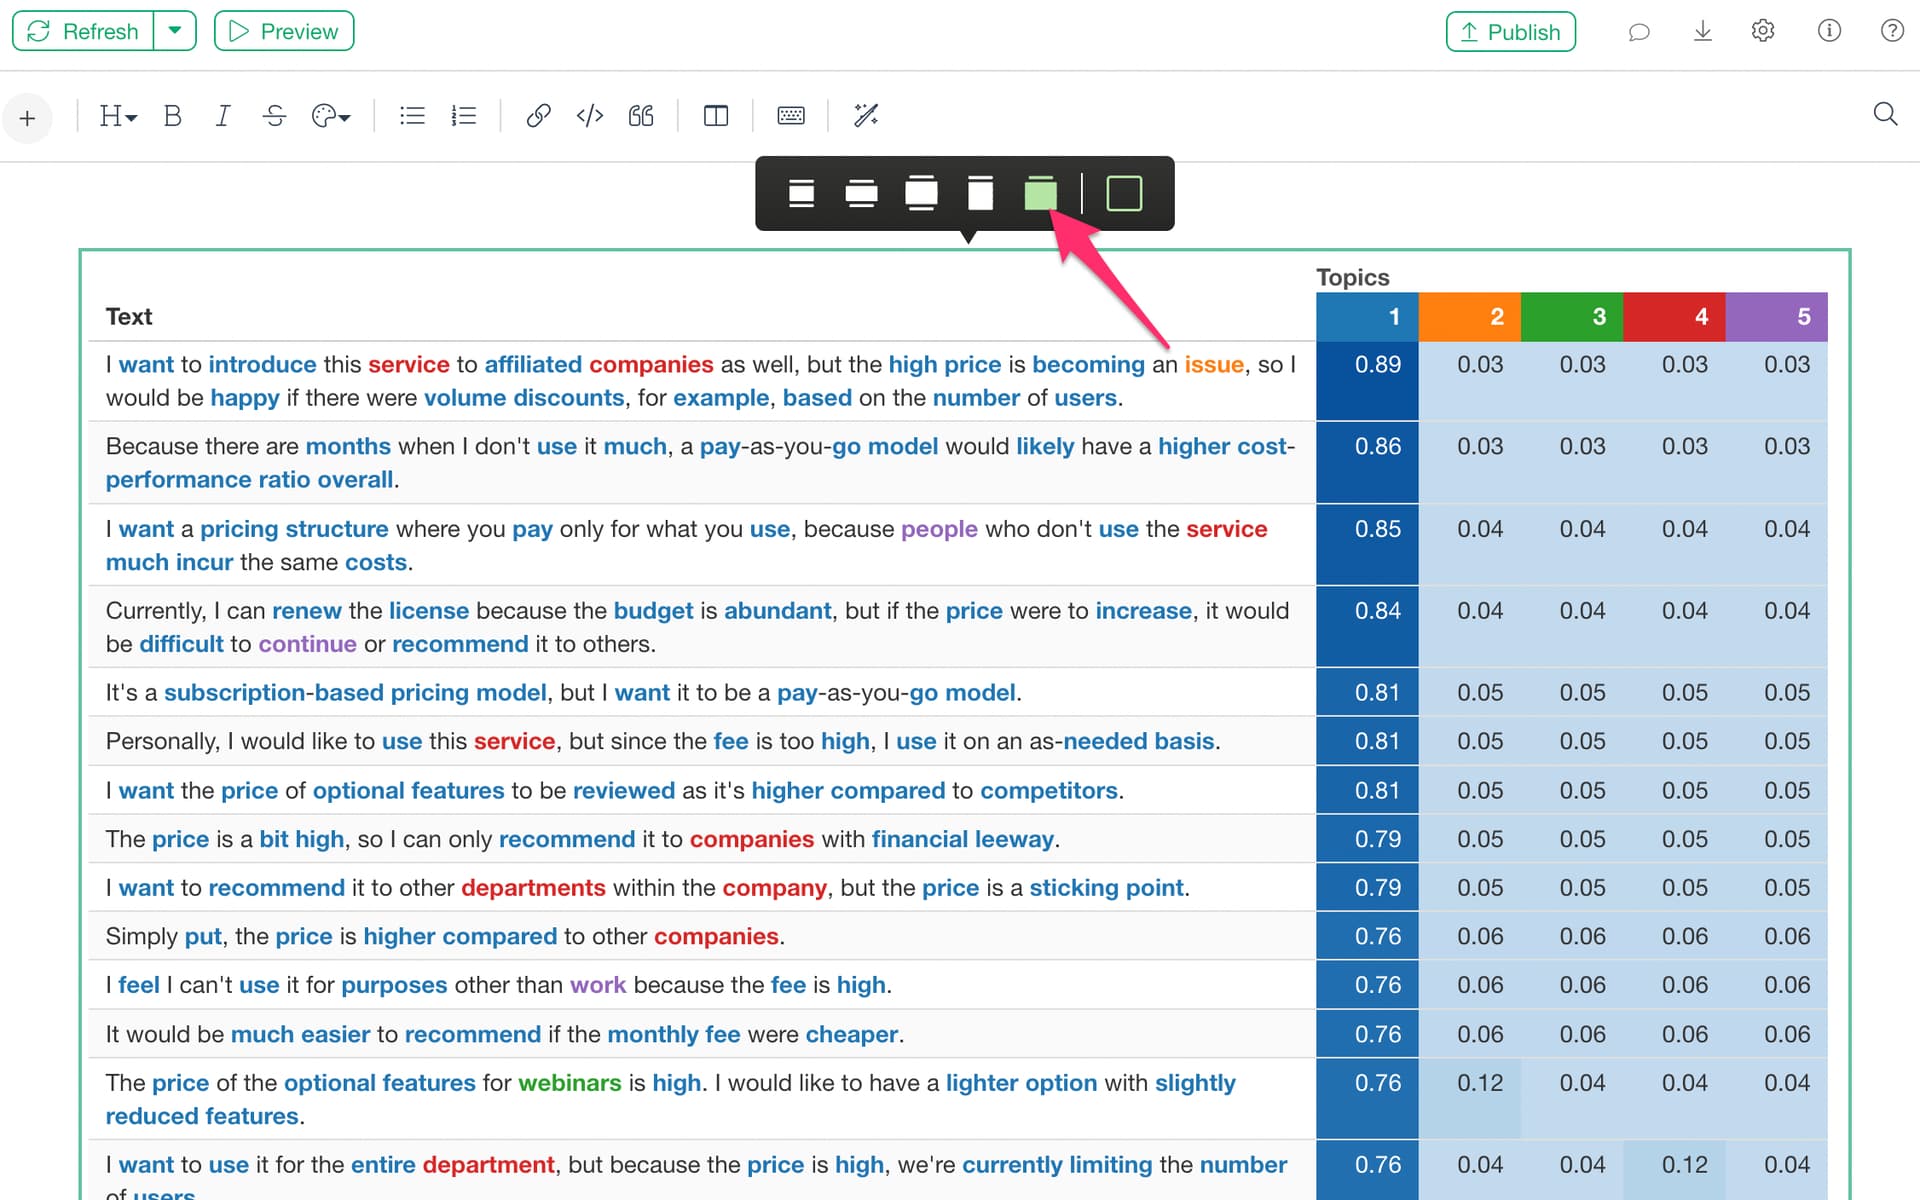
After adding the chart, select the full size on the far right.
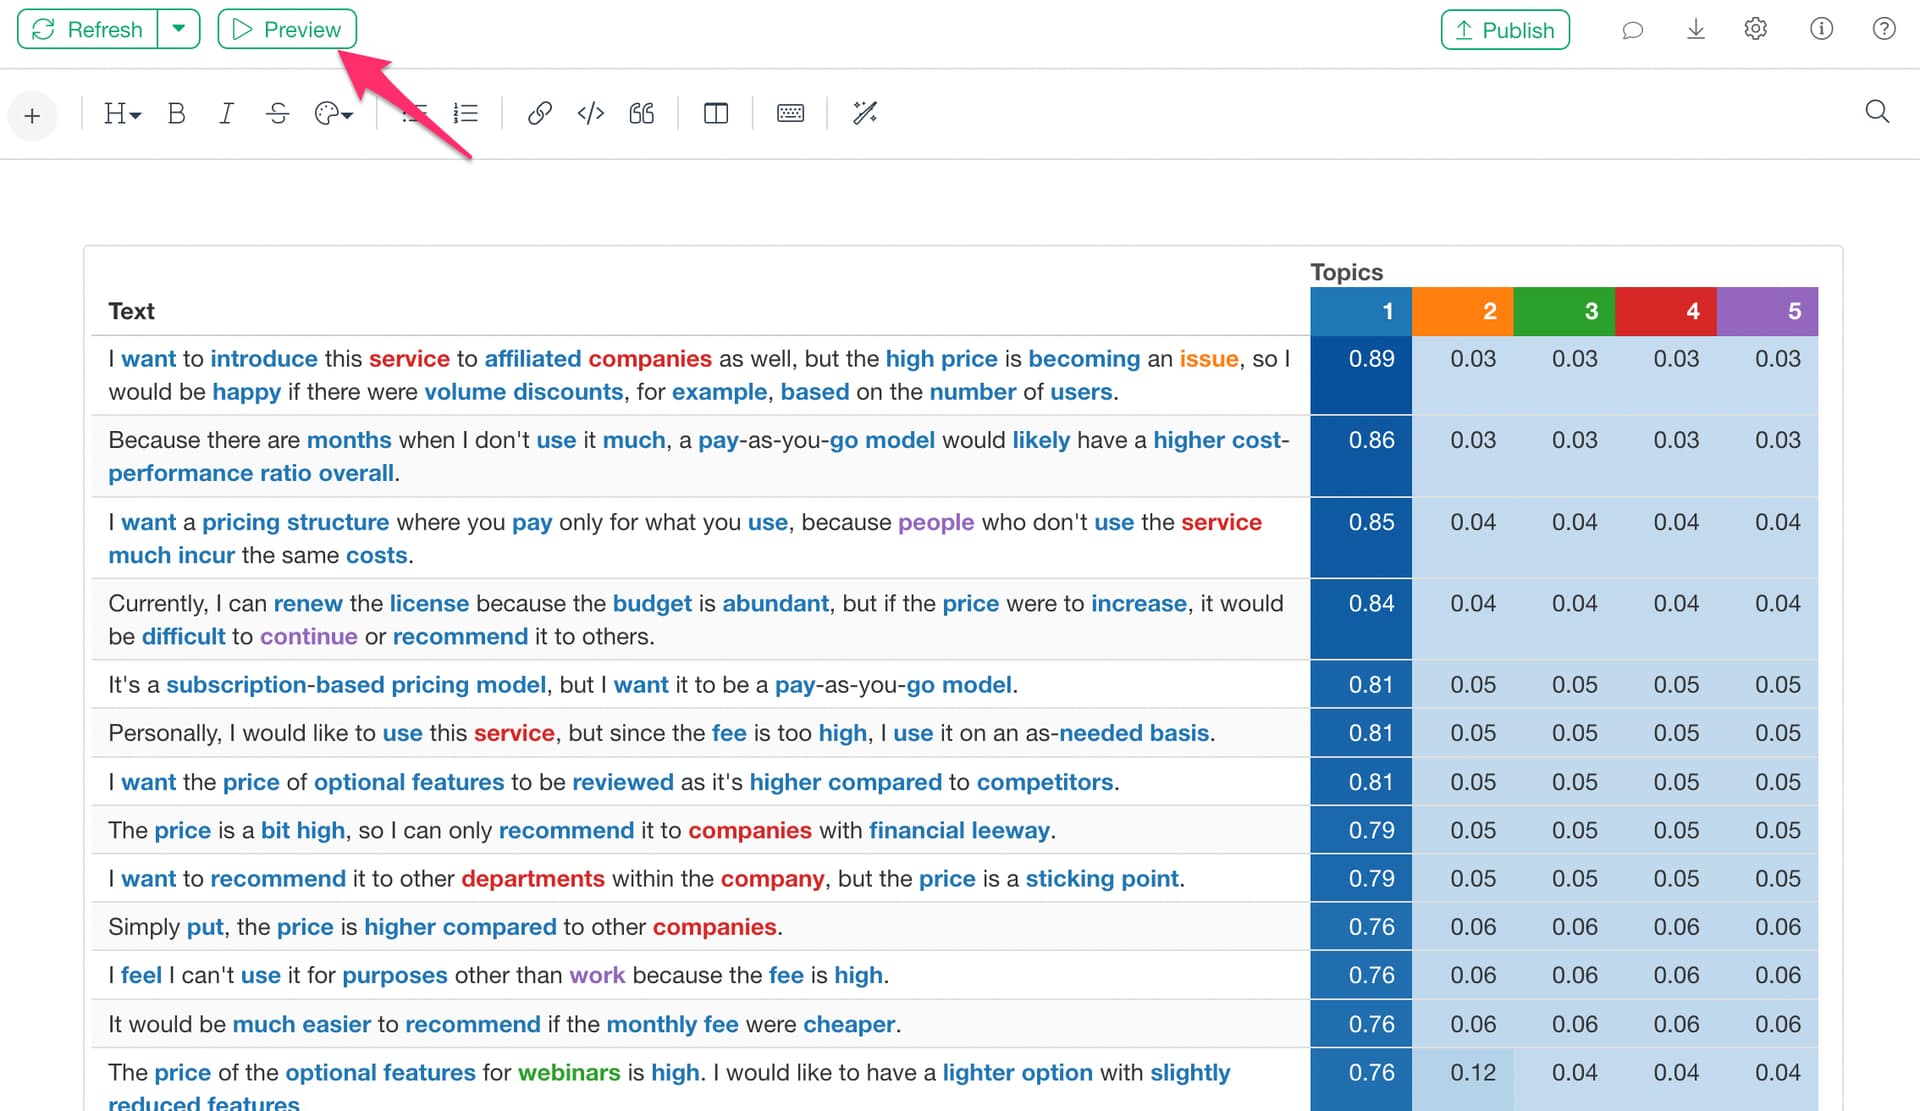
Preview and display on the browser side.
On the browser side, you can save it as PDF by clicking “Command + P” on Mac or “Ctrl + P” on Windows.