We recently had this question from one of our users at the chat on our website, and I wanted to share how to do.
If you want to know more about ‘winsorize’, here’s a link for the wikipedia.
- You can create an R script and define a function like below.
winsor <- function (x, fraction=.05)
{
   if(length(fraction) != 1 || fraction < 0 ||
         fraction > 0.5) {
      stop("bad value for 'fraction'")
   }
   lim <- quantile(x, probs=c(fraction, 1-fraction))
   x[ x < lim[1] ] <- lim[1]
   x[ x > lim[2] ] <- lim[2]
   x
}
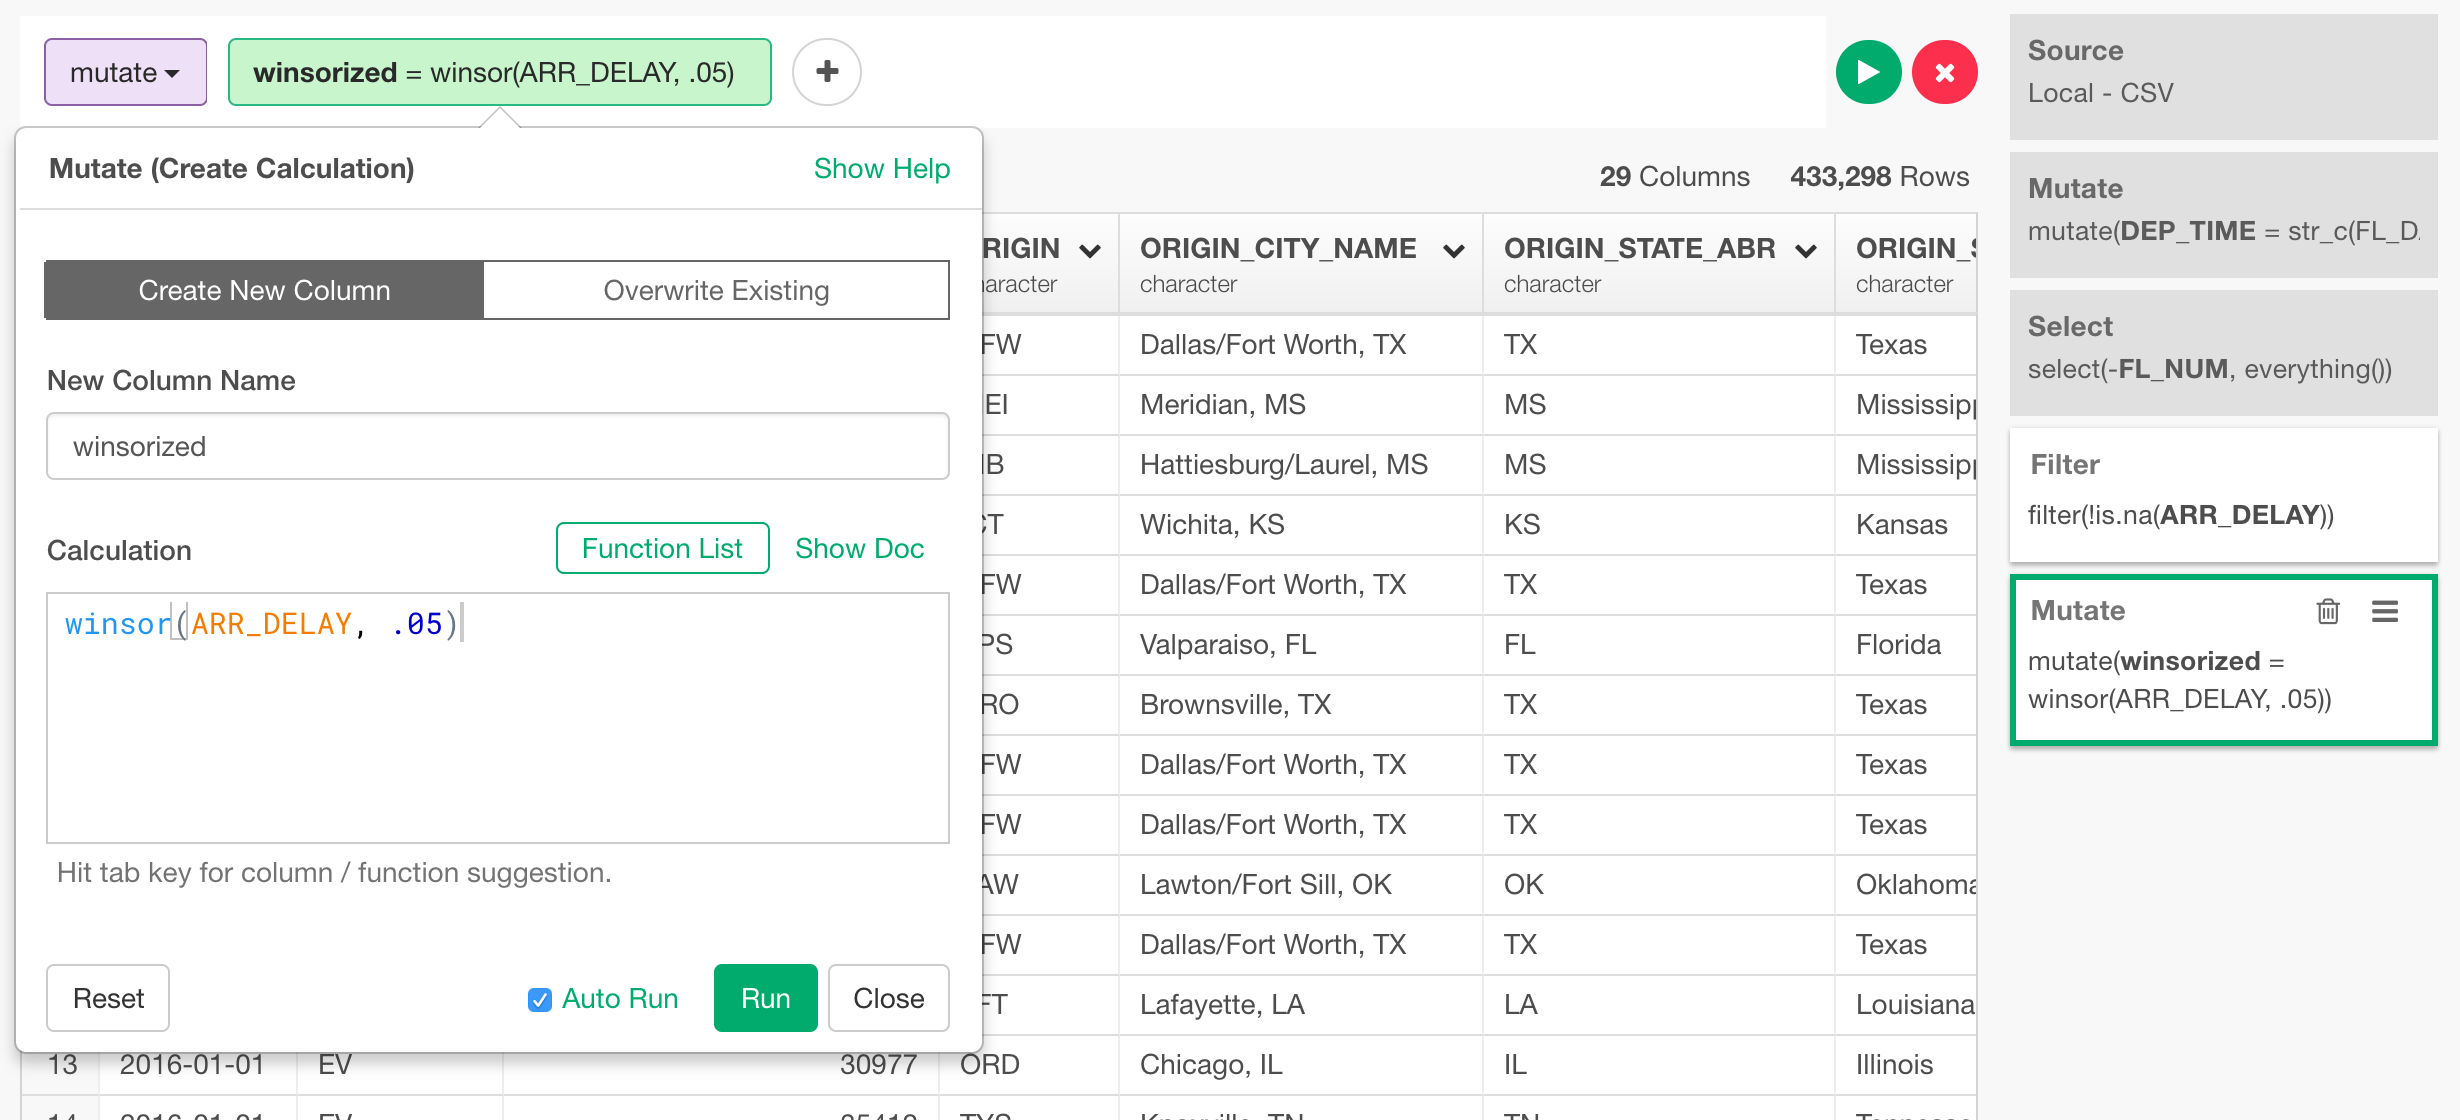
Then use it inside ‘mutate’.
This will give you a chart like below.
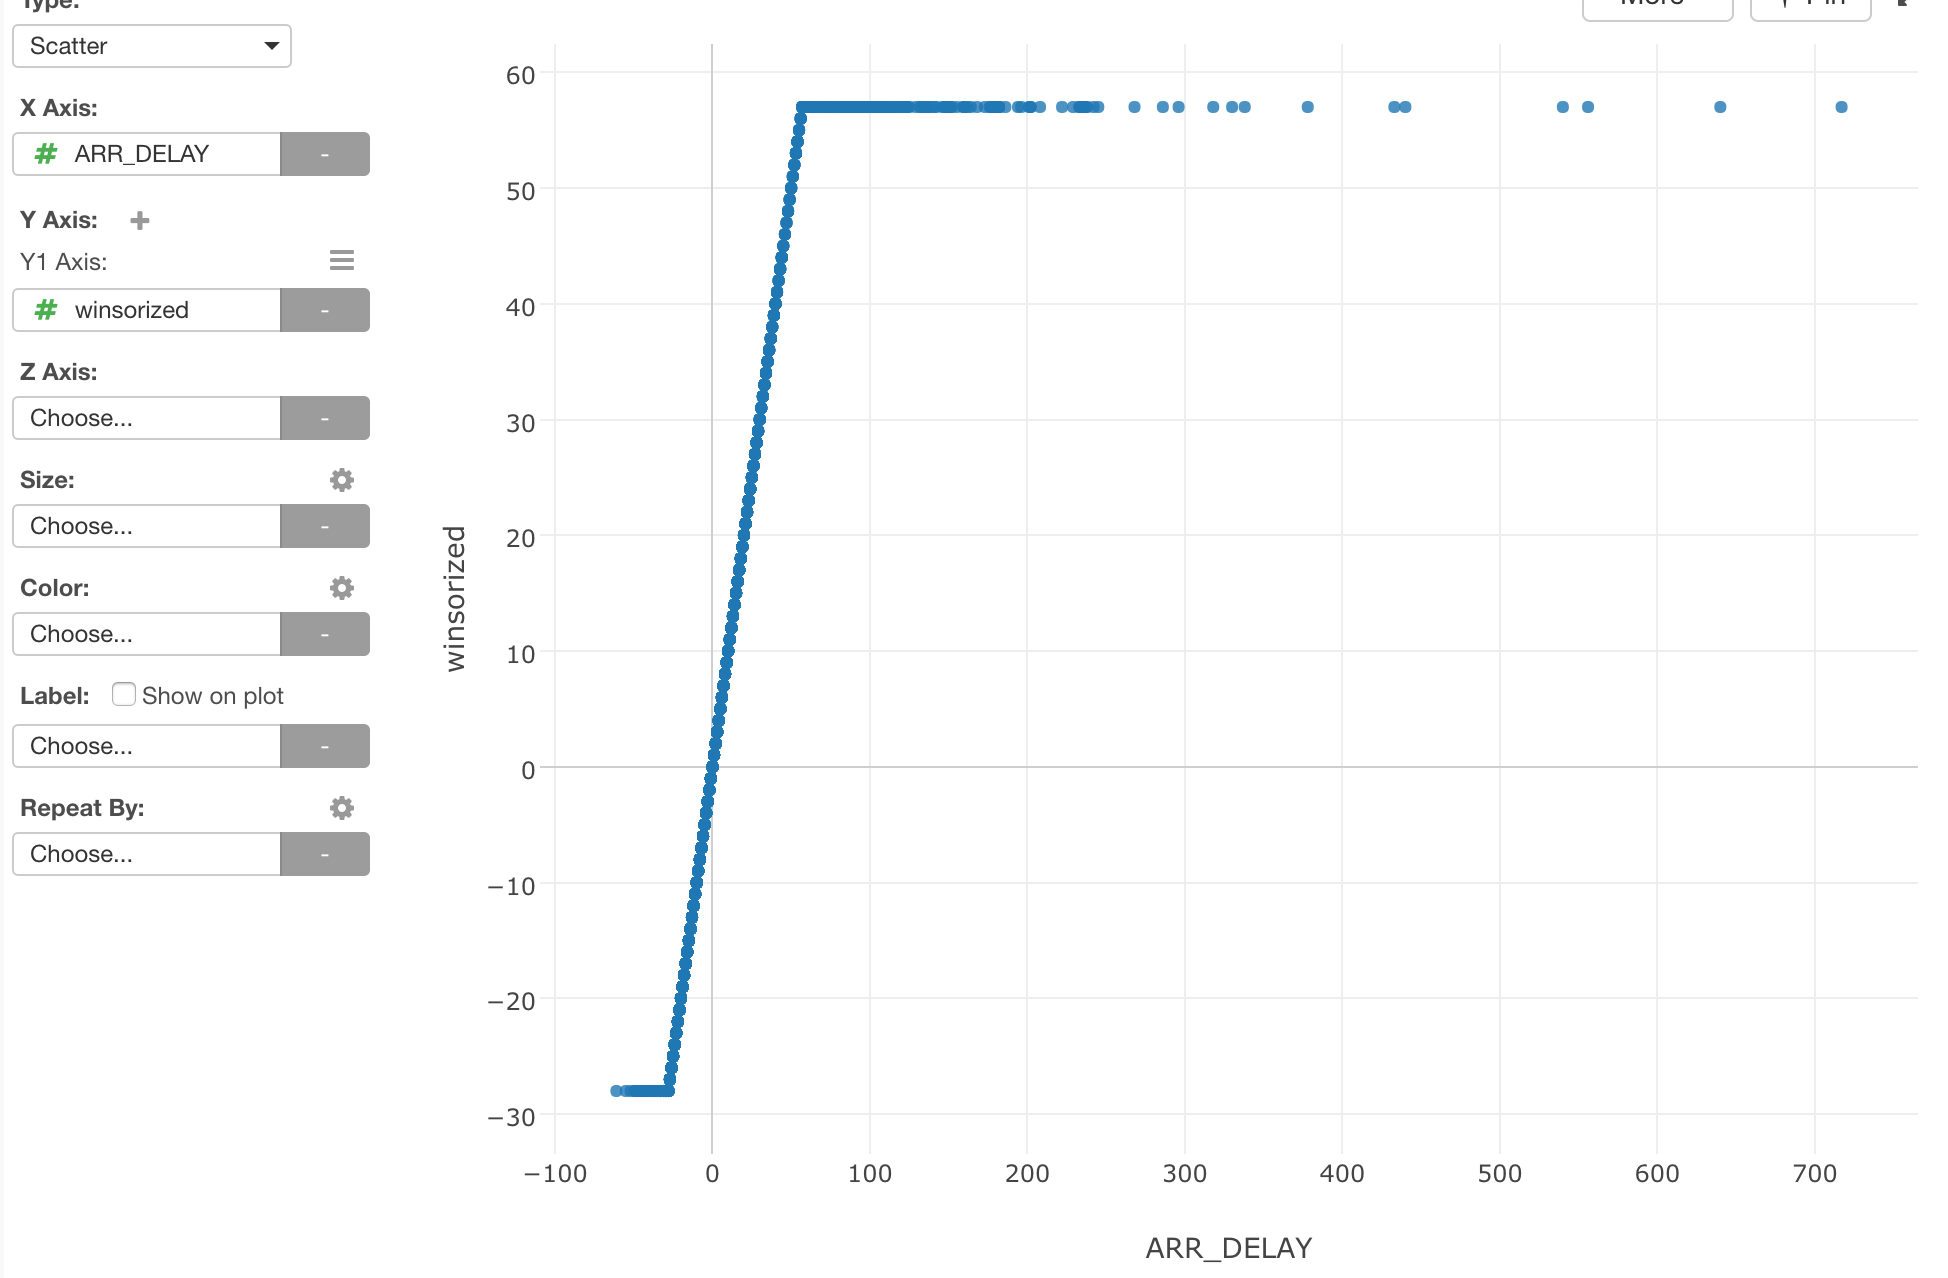
You can see how the data is ‘winsorized’.