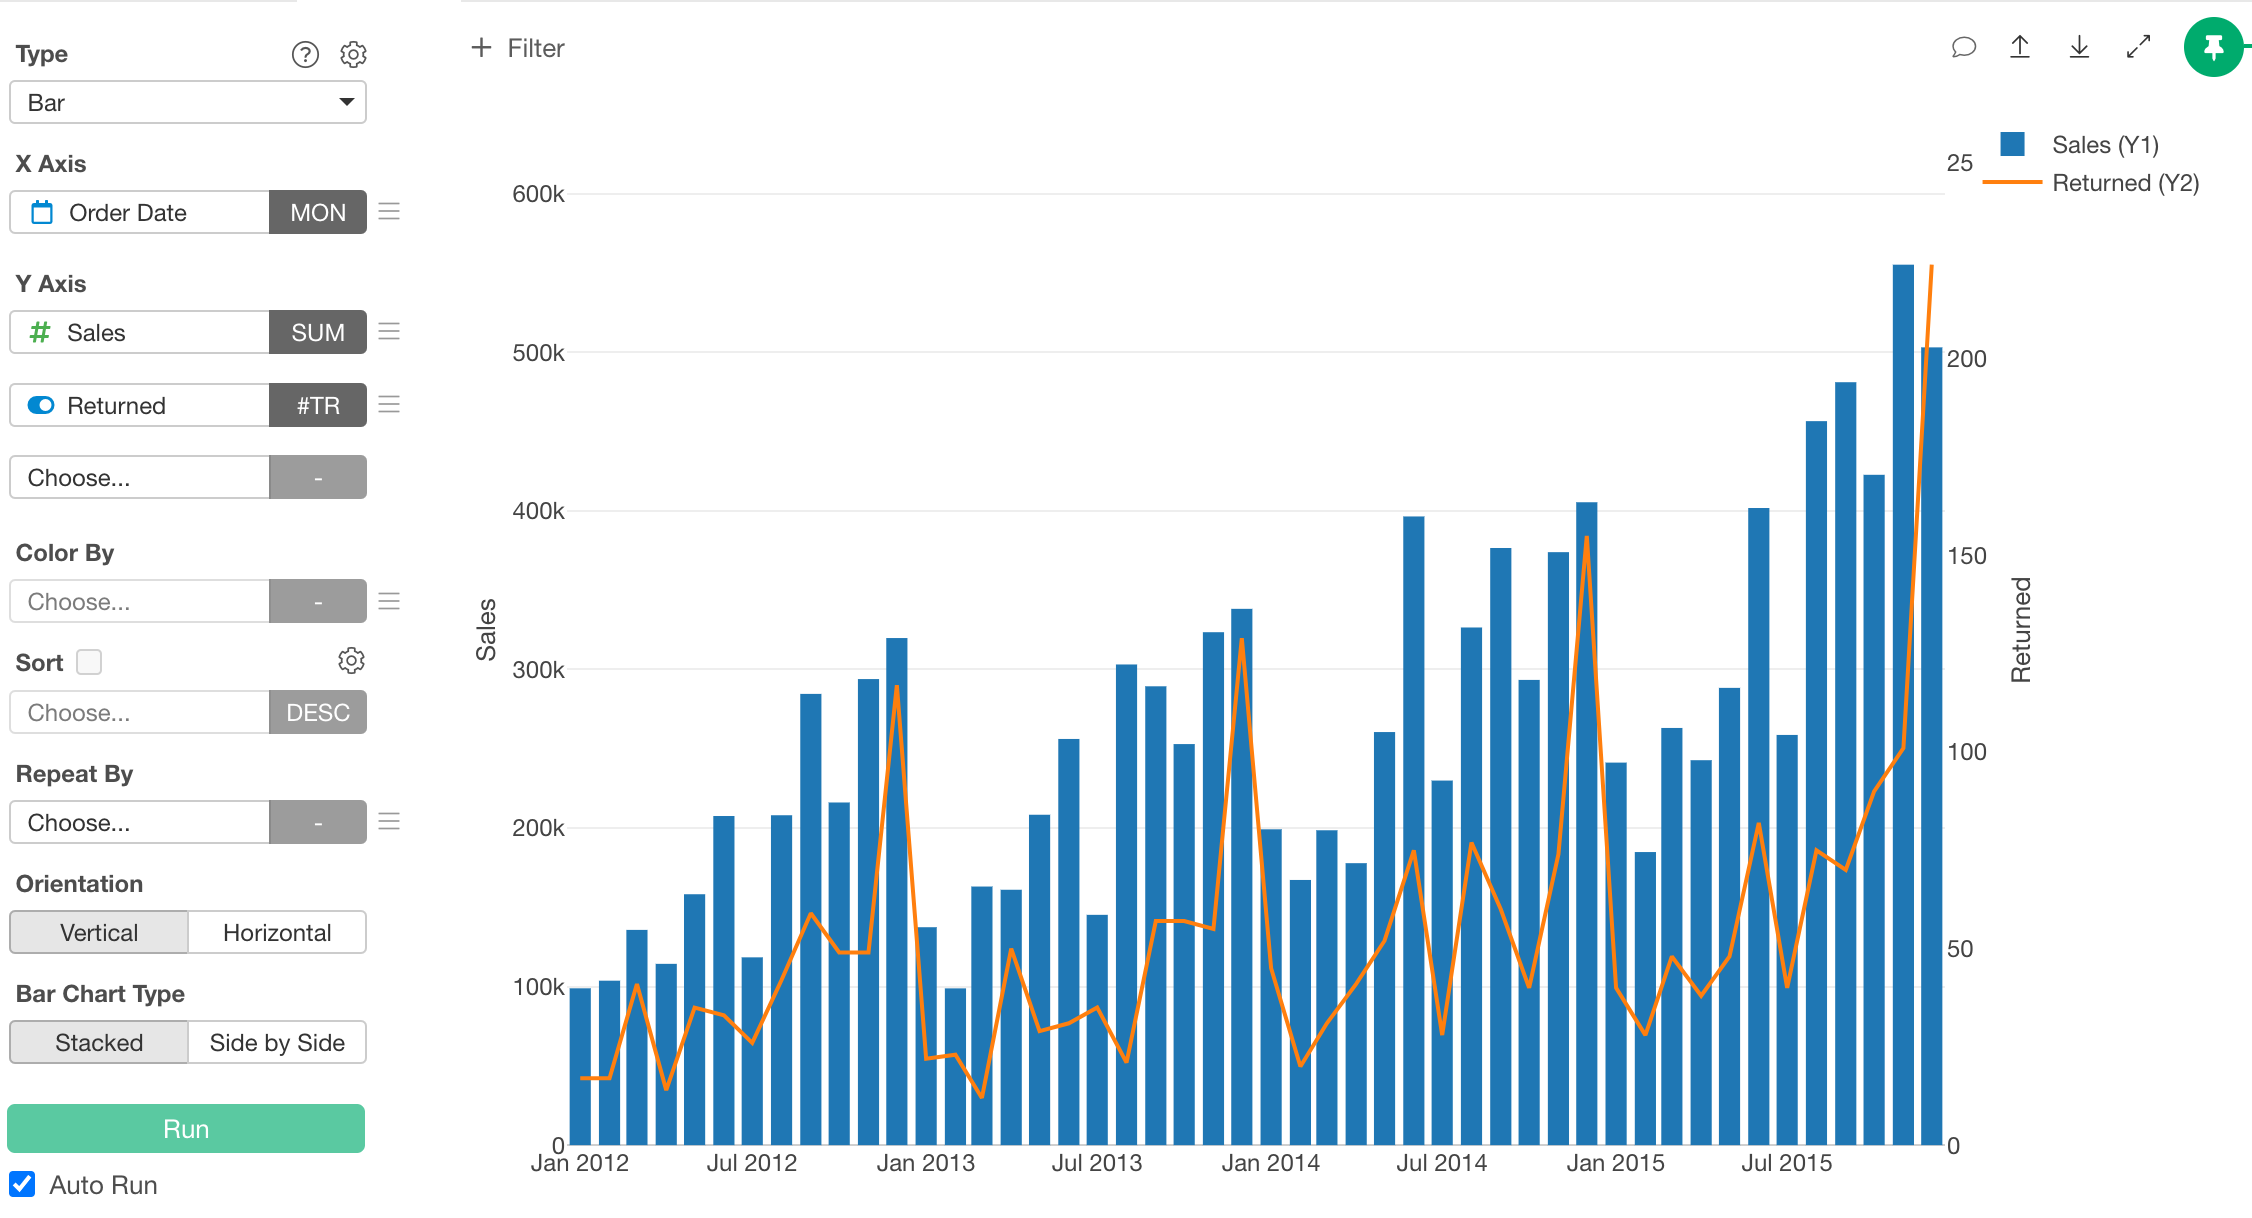
There are times when you may want to visualize both bars and lines in a single chart.
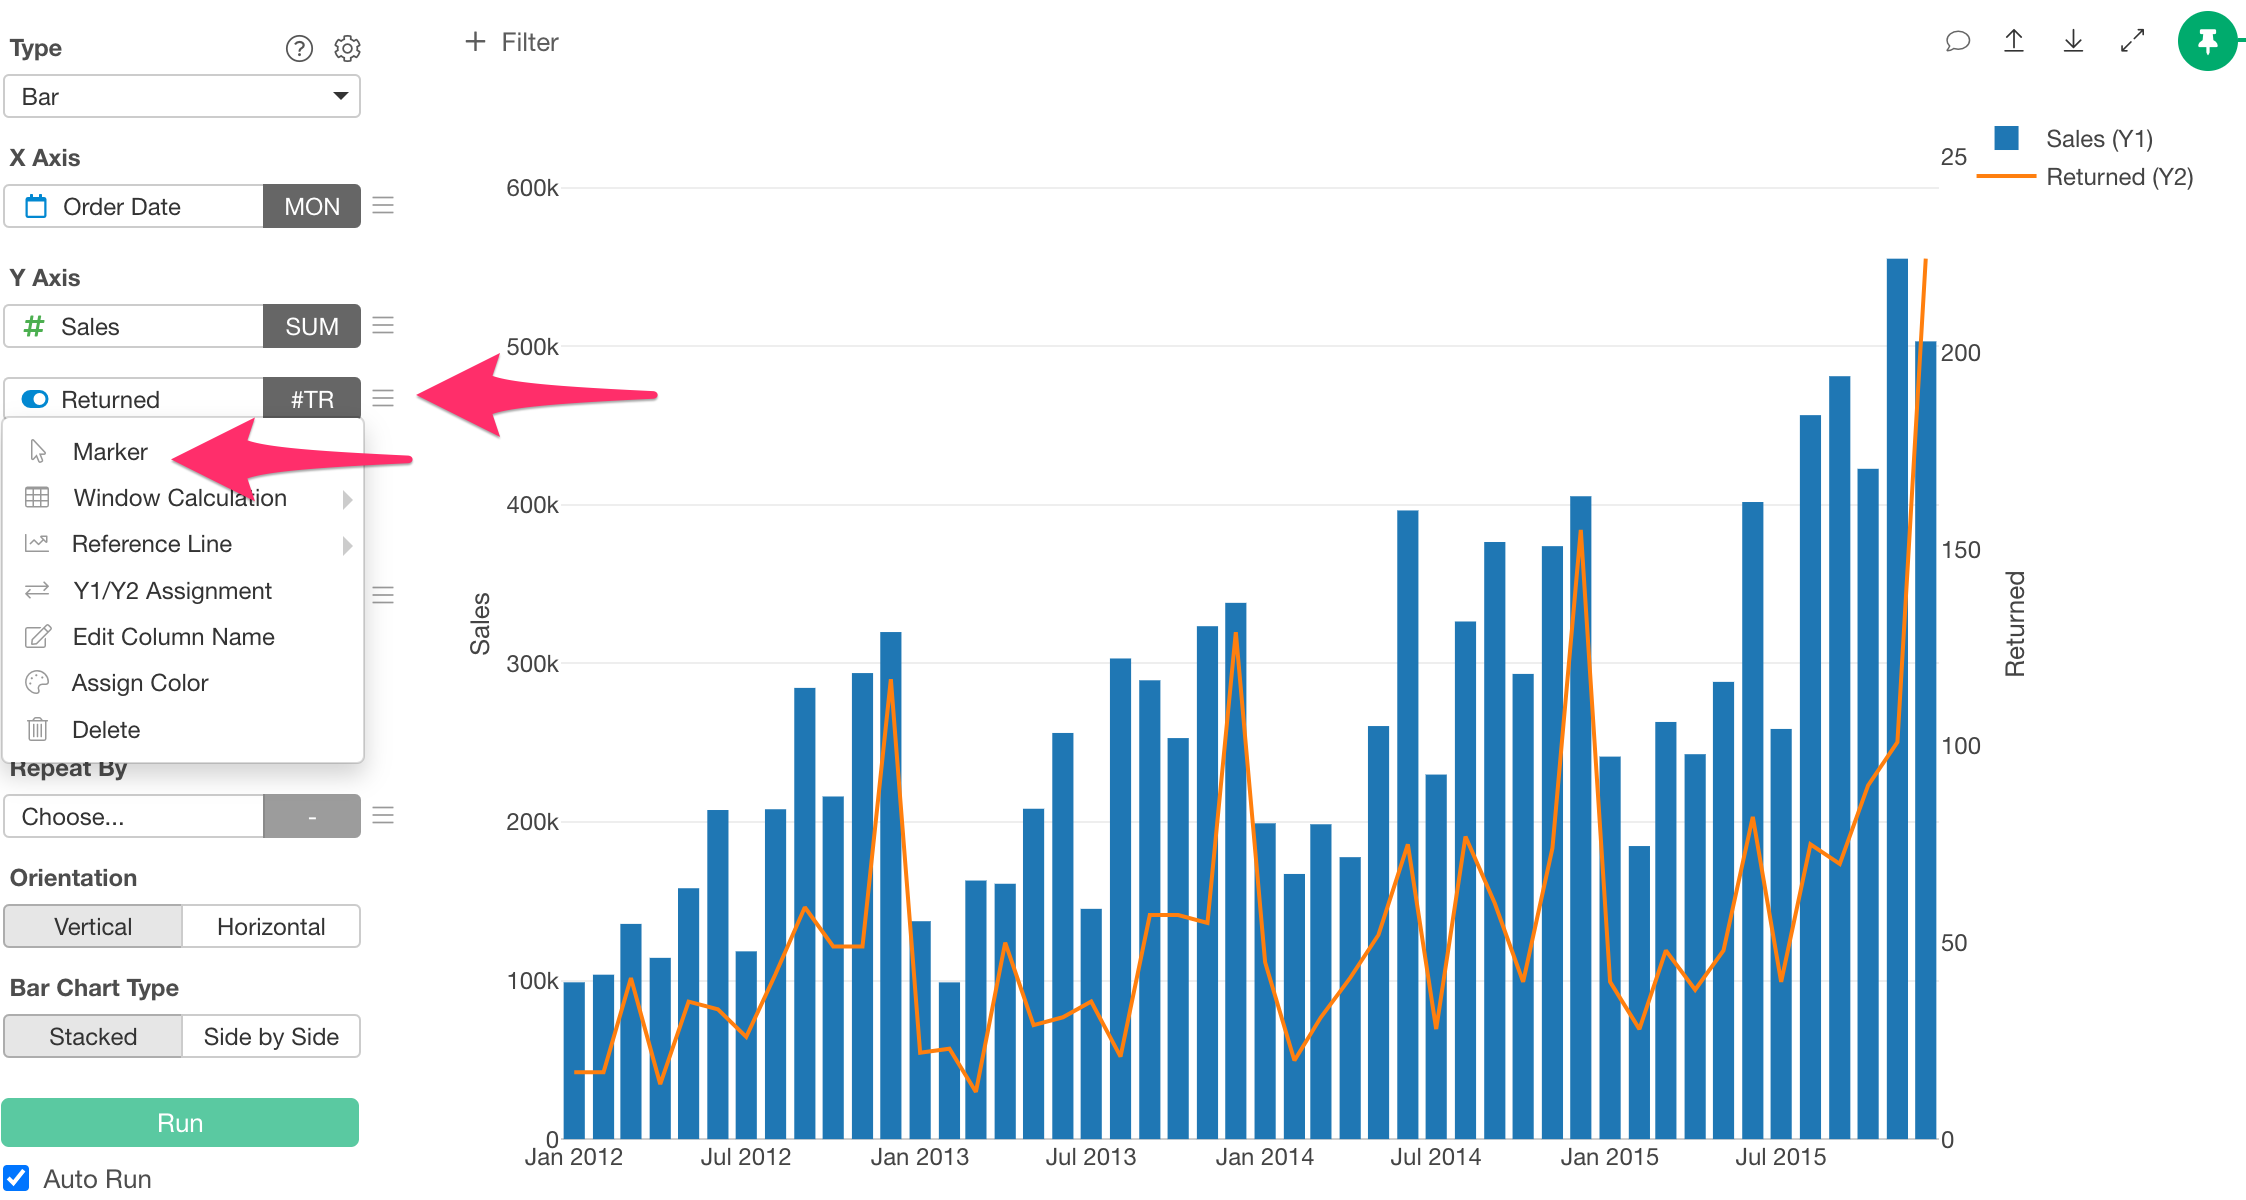
In such cases, you can achieve this by changing the “Marker” setting in the menu for the selected Y-axis value.
For more details, please refer to the link below: