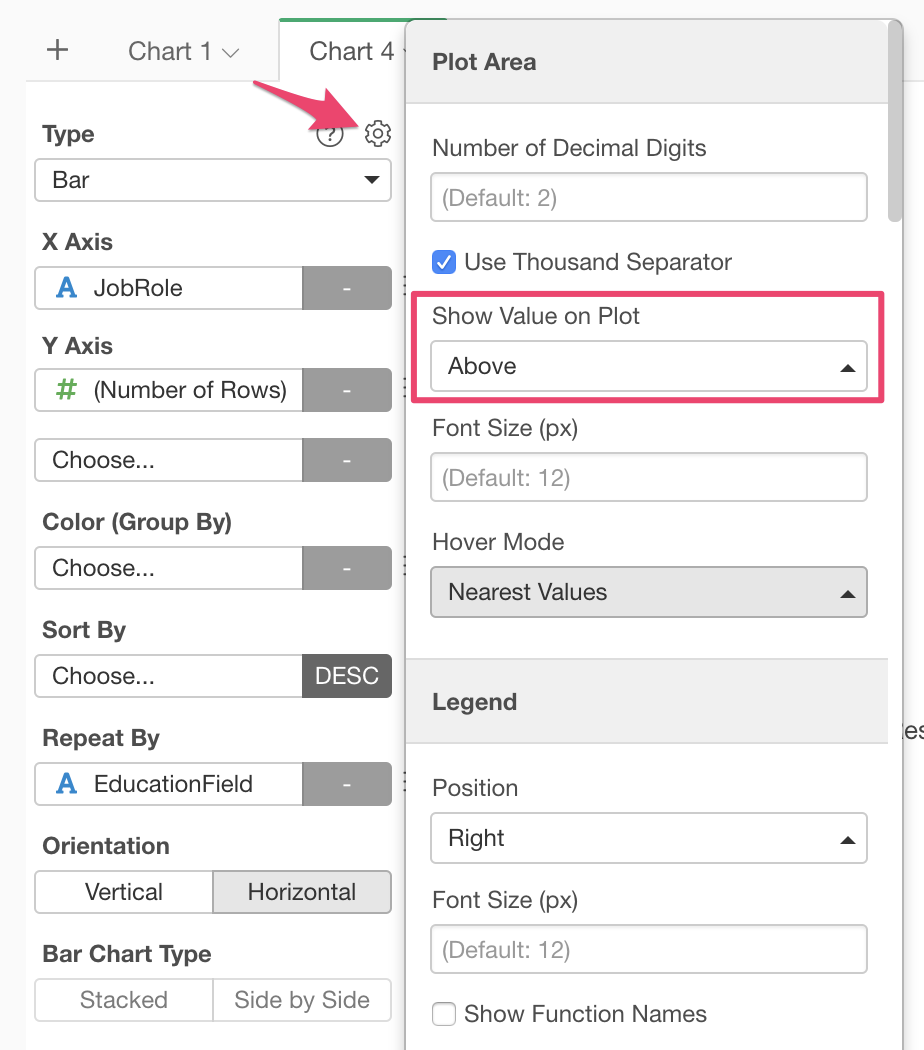
Here is how to show values on a chart plot area like this.

You can click the ‘Gear’ icon to open the chart property dialog and choose either ‘Above’ or ‘Below’. If you choose ‘Above’, values show up above the markers such as Bar or Line, and values show below the markers if you chosse ‘Below’.