You can use the “Diff from Period Ago” window functions.
Suppose you have sales data. You can assign the Order Date (Month) to X-axis and the Sales (Sum) to Y-axis on the Line chart to show the monthly sales.
You can draw another line that shows a difference from the previous month. Here is how to.
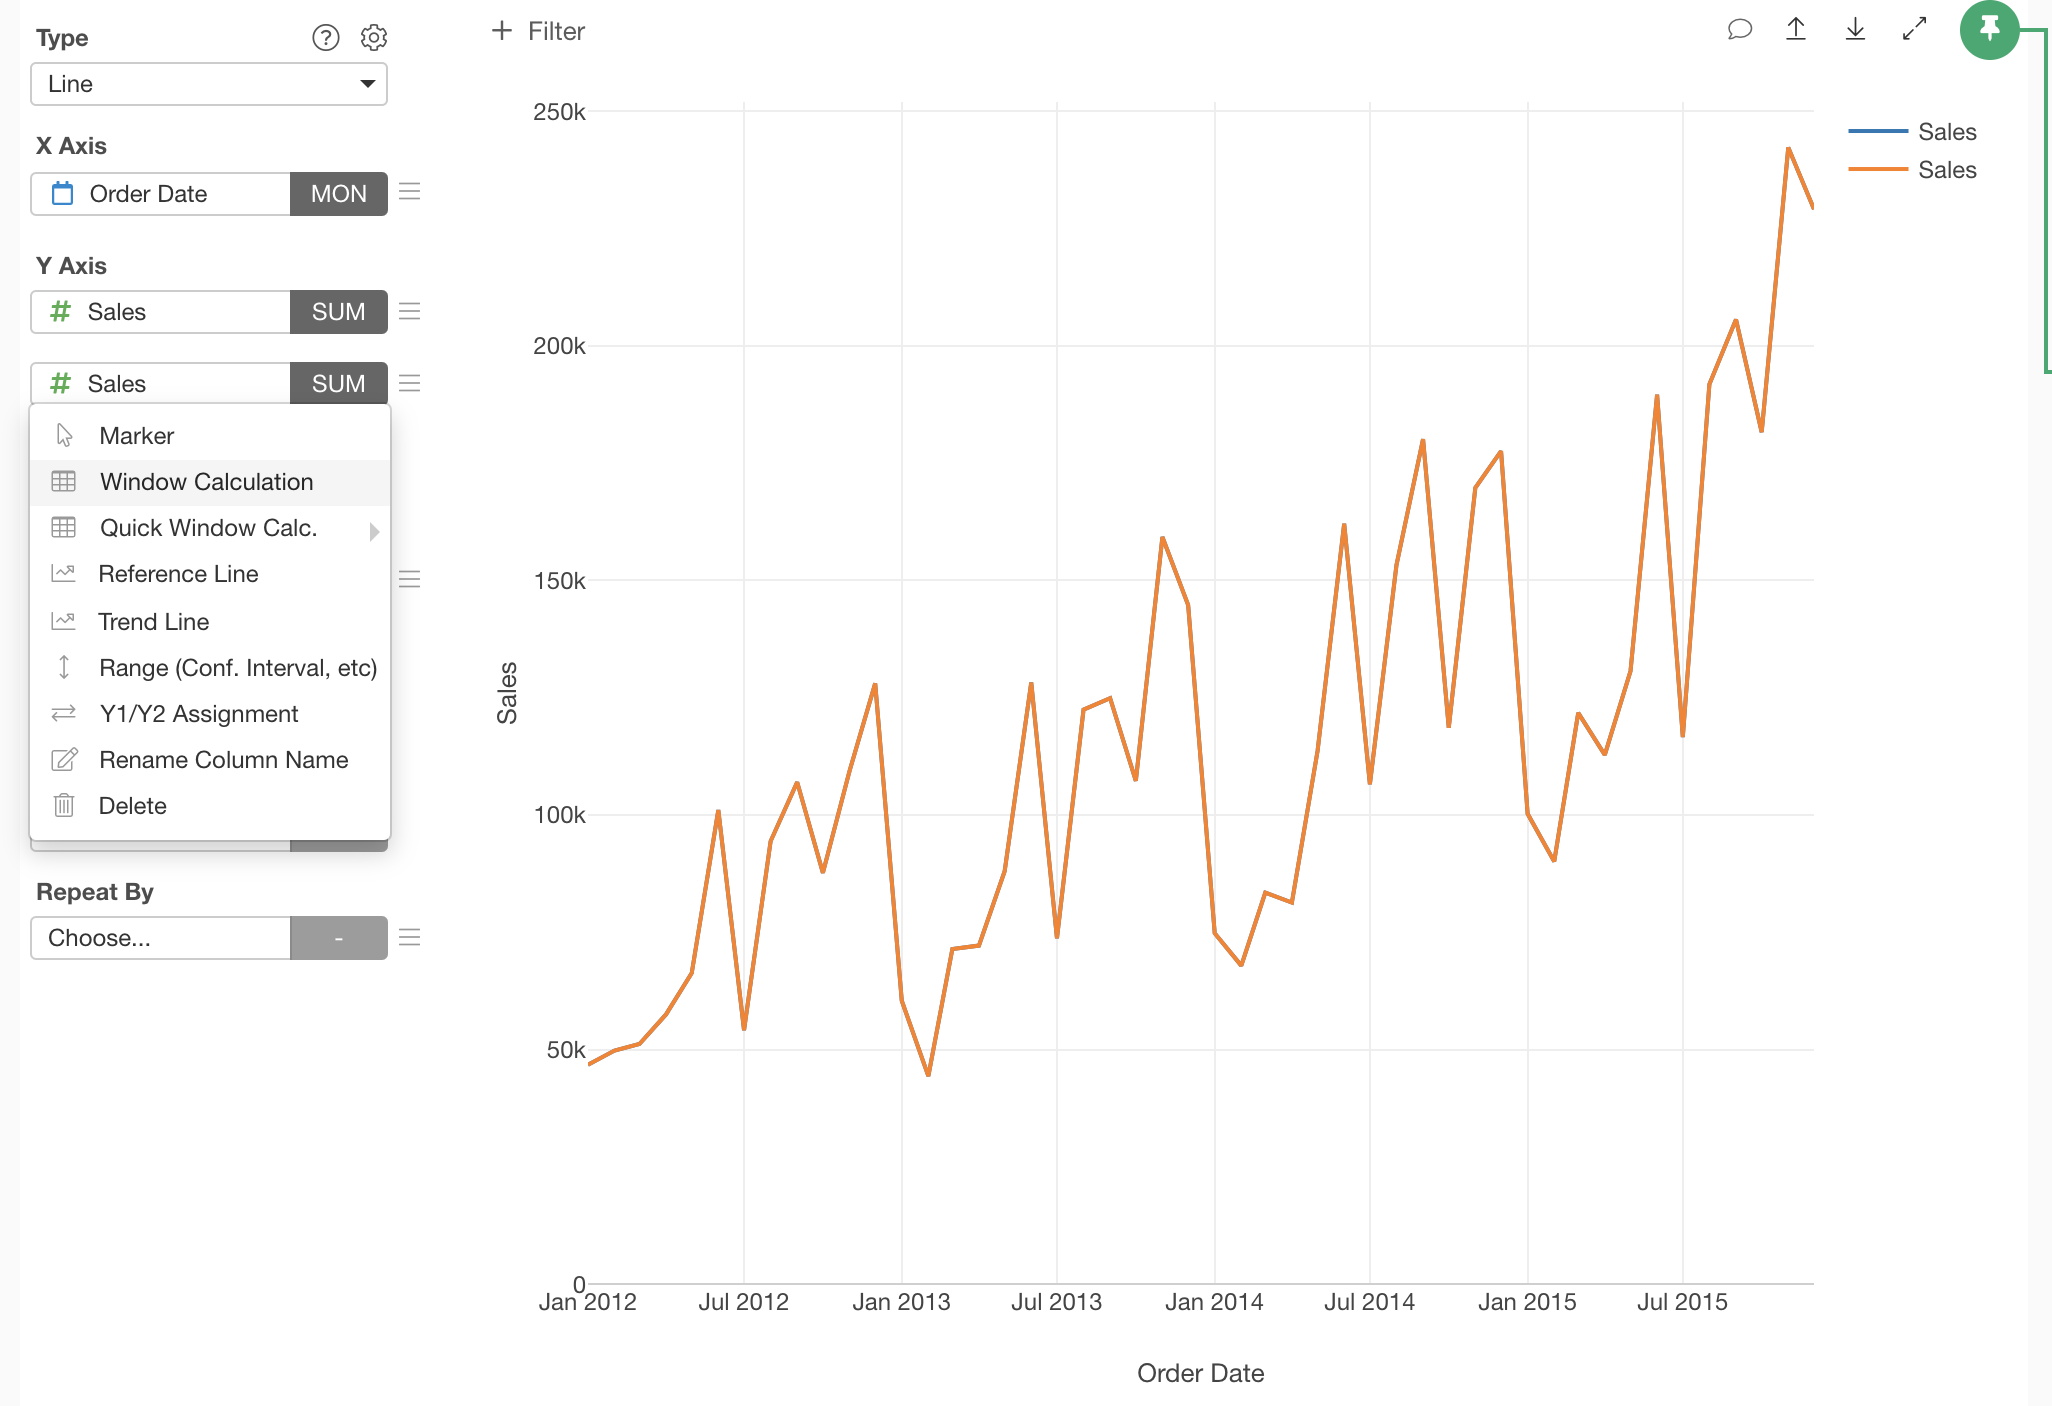
- Assign Sales (Sum) on the 2nd Y-axis.
- Select the “Window Calculation” menu.
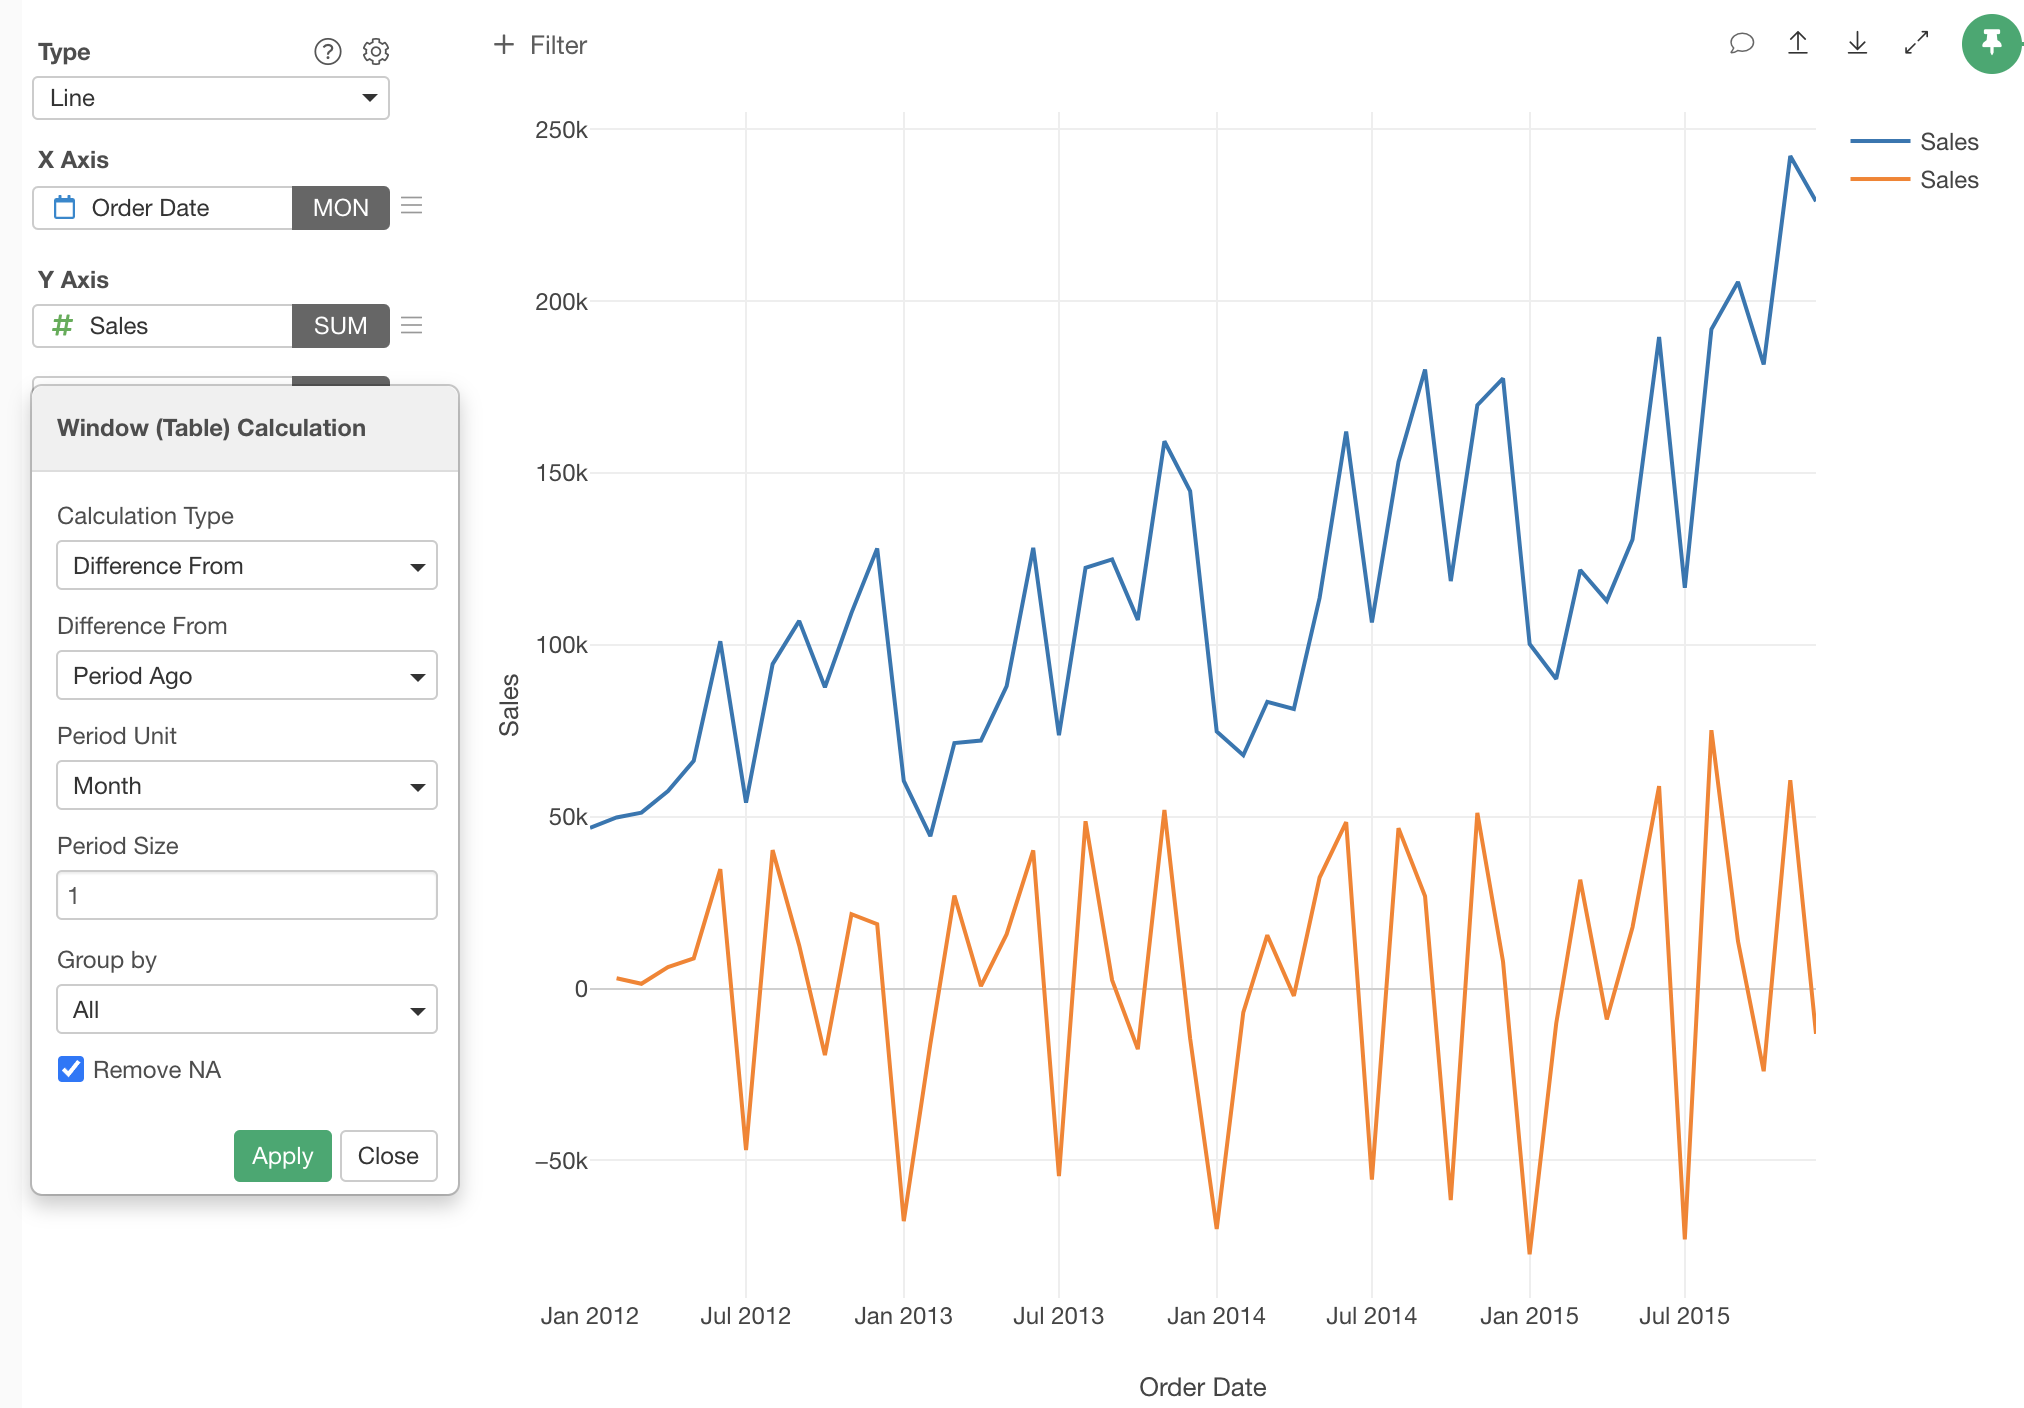
- Choose “Difference From” for the type.
- Choose “Period Ago” for the Difference From.
- Choose “Month” for the Unit.
Now, the orange line shows a difference from the previous month.