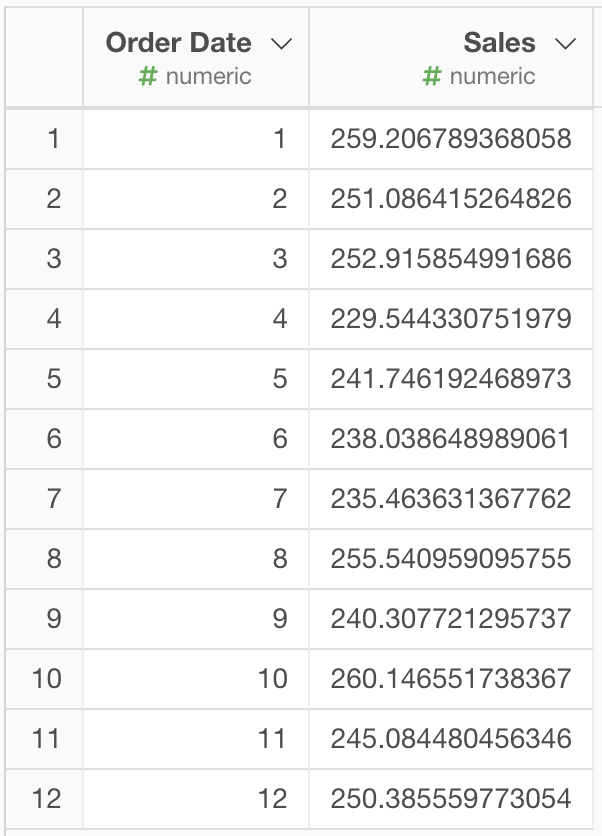
Suppose if you have monthly sales data. The order date column contains month numbers from 1-12 like the following.
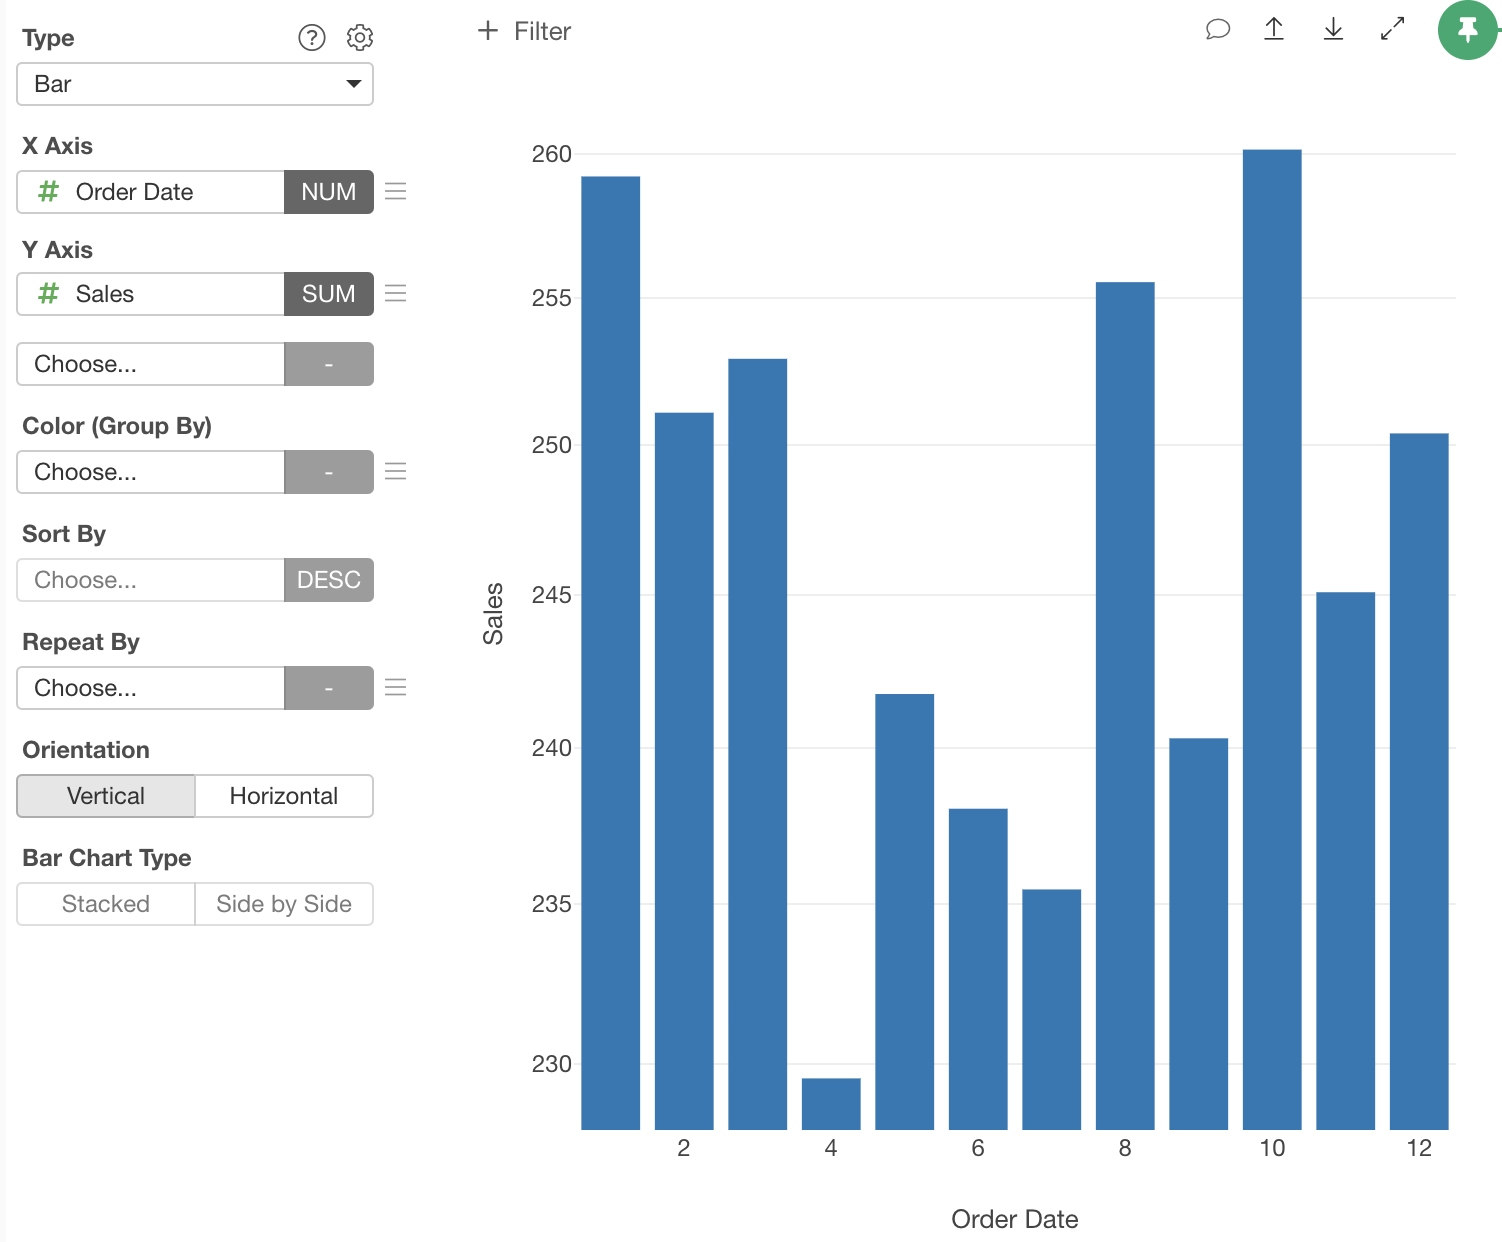
If you create a Bar chart with this data, sometimes you see the labels only for some bars depending on the screen size like the following.
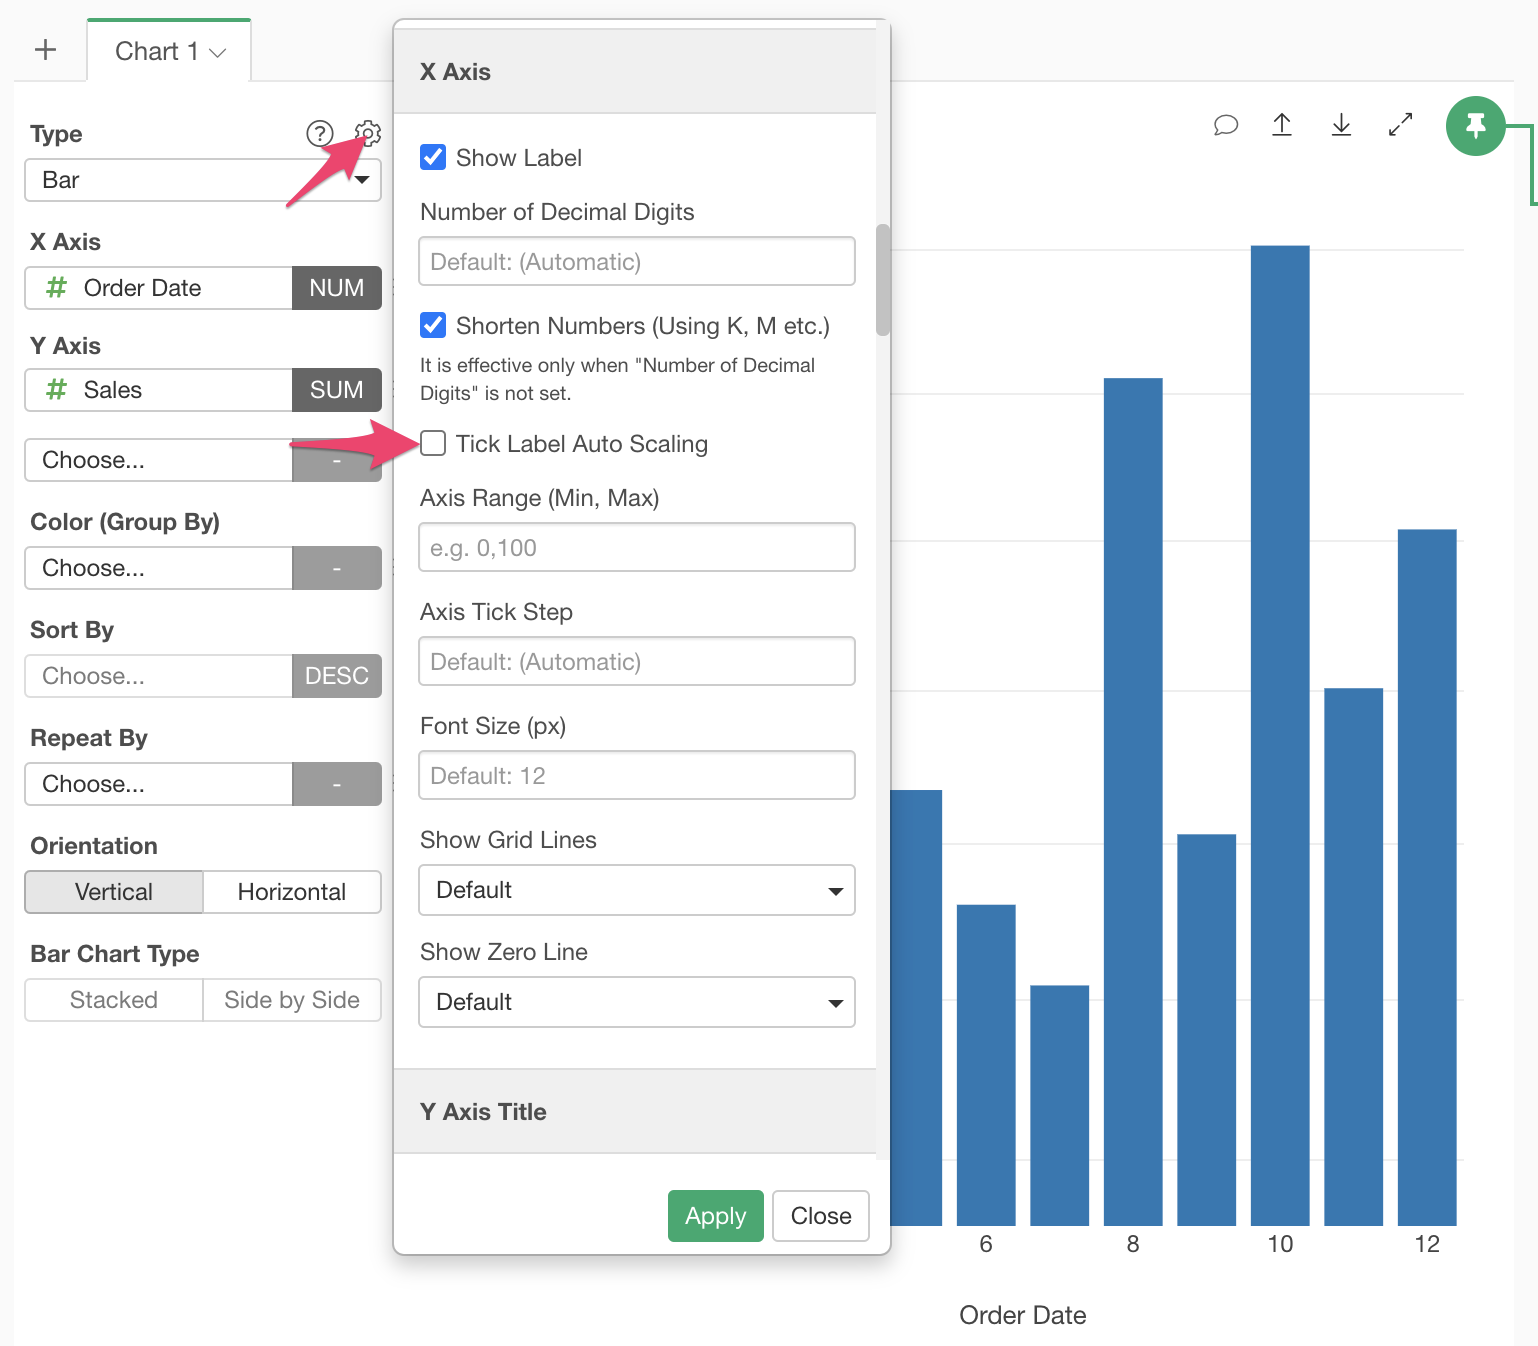
If you want to show the labels for all the bars, here is how.
Open the chart property dialog and uncheck the “Tick Label Auto Scaling” option.
Then, it will show labels for each bar.
