Let’s say our company’s financial period starts from March and ends at the end of February. Now, we want to aggregate the revenue for each finanical year like below.
e.g.
2016-03-01 - 2017-02-28 -> 2016, $200,000
2017-03-01 - 2018-02-28 -> 2017, $300,000
We can do this with the steps below.
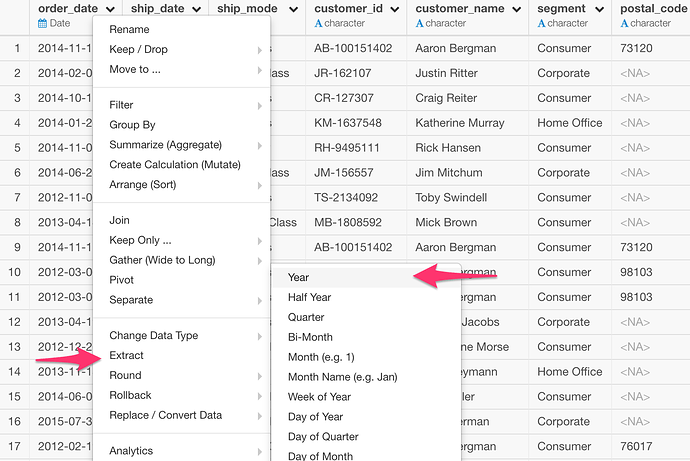
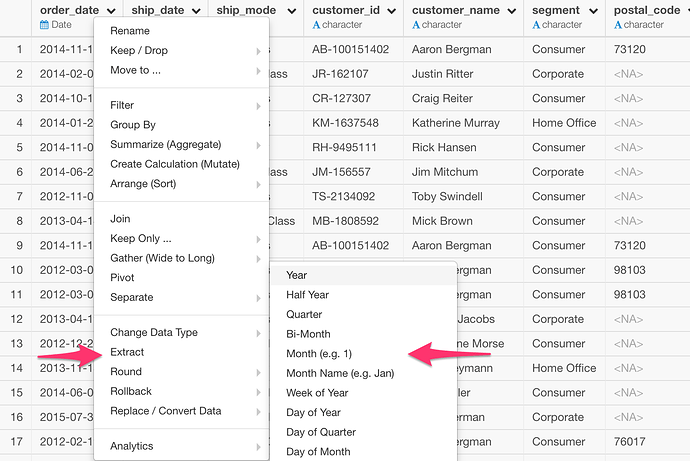
- Extract Year and Month from the data column
Year
Month
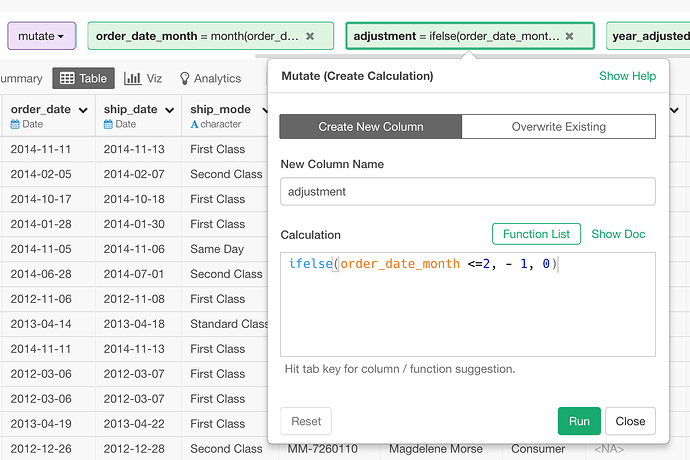
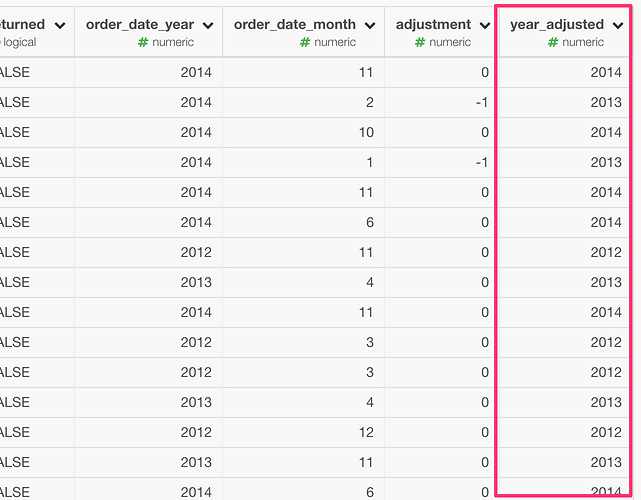
2. Create a new column that calculates an adjustment based on which month
This evaluates if a given month is Jan (1) or Feb (2) and it gives -1 if TRUE, otherwise 0.
ifelse(order_date_month <=2, - 1, 0)
We are going to use these values at the next step to subtract 1 from year for Jan and Feb.
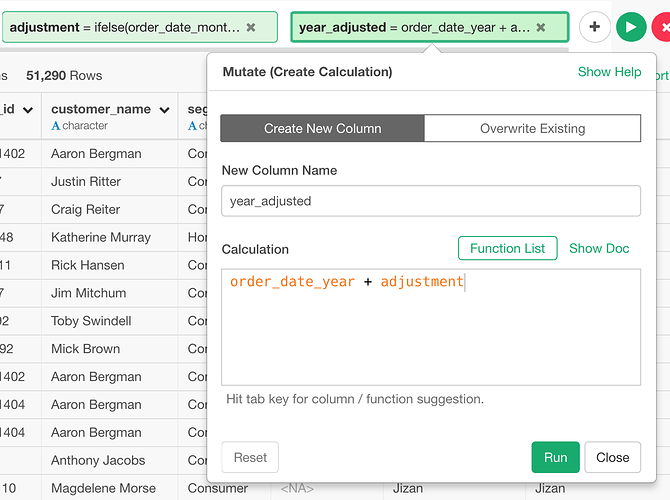
3. Finally, we can add the adjustment to the year column values.
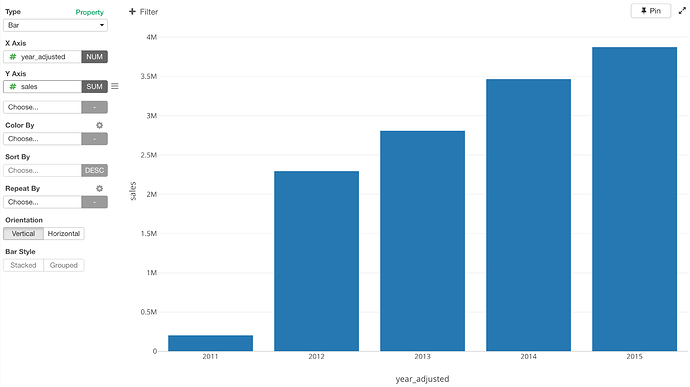
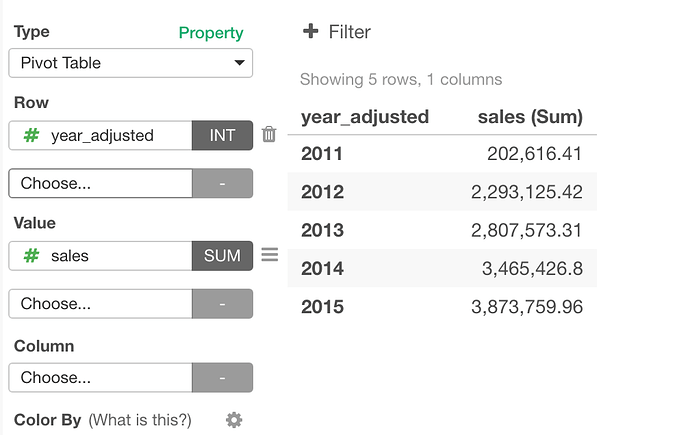
Once we get this, then we can simply visualize it with charts like Bar chart or Pivot table by assigning this newly created Adjusted Year column like below.

