You can plot your H3 (Uber’s Hexagonal Hierarchical Spatial Index) data on Exploratory desktop using a Note. Here is how.
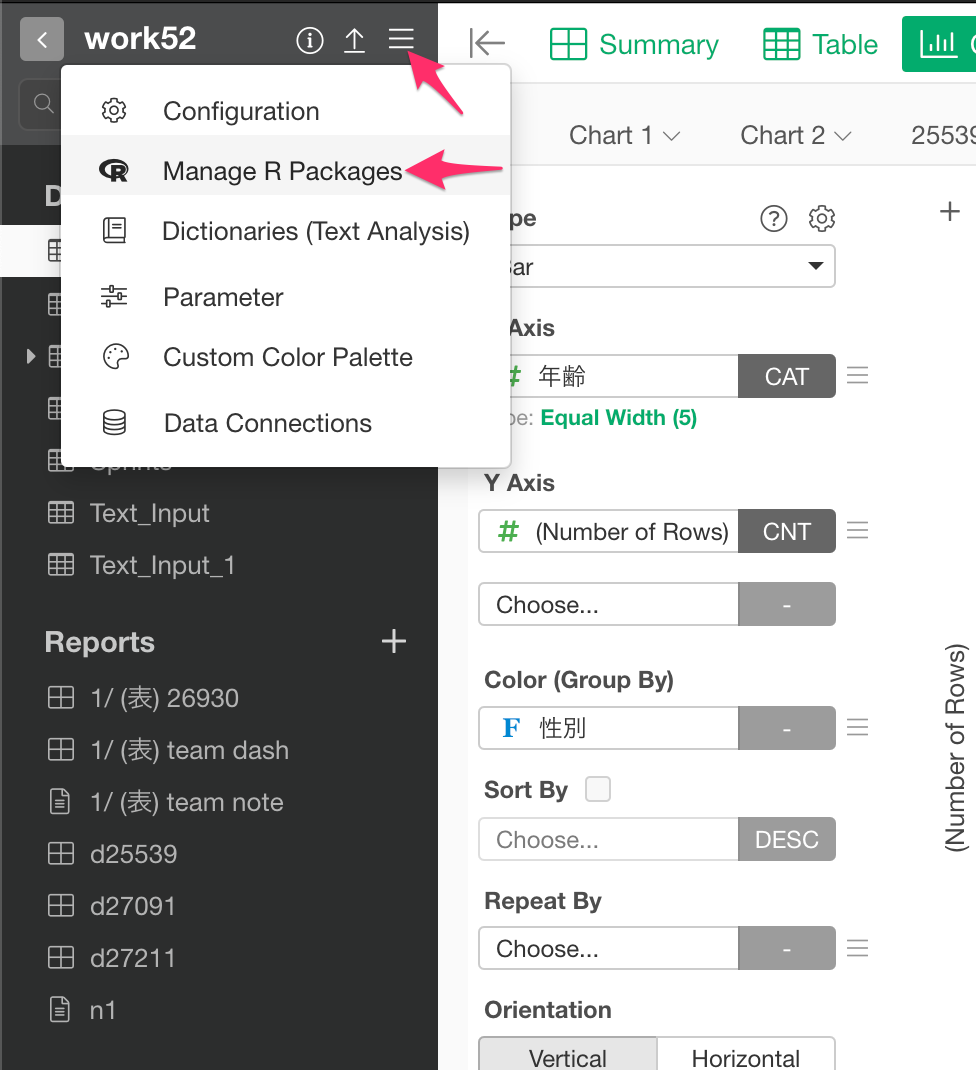
- Open the “Manage R Packages” dialog.
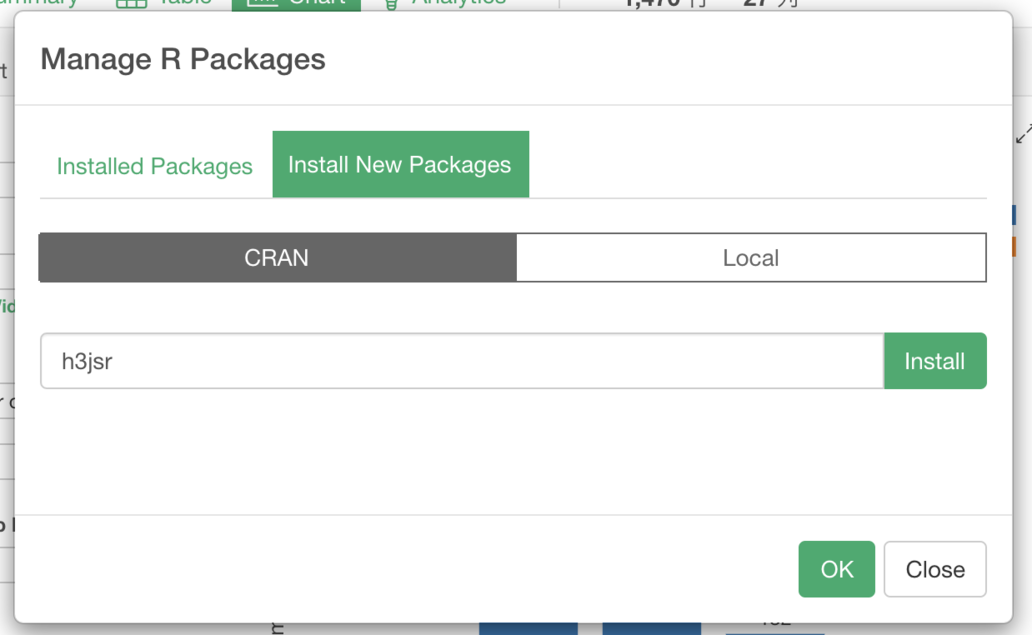
- Install ‘h3jsr’ R package.
-
Install ‘leaflet’ R package in the same way.
-
Create a new Note and cut and paste the following example code. The sample data is originally from the h3jsr page.
```{r warning=FALSE, message=FALSE, echo=FALSE, cache=TRUE, dpi=300 }

# Convert H3 data to polygon
brisbane_hex_10 <- cell_to_polygon(input = "8abe8d12acaffff")
leaflet(data = brisbane_hex_10, width="600px", height="600px") %>%
addTiles()%>%
  addPolygons(
    weight = 2,
    color = "blue"
 )
```
