You can normalize the values with ‘normalize’ function.
When you do you want to ‘Group By’ the data first if you want to normalize for each group (e.g. company, product, etc.)
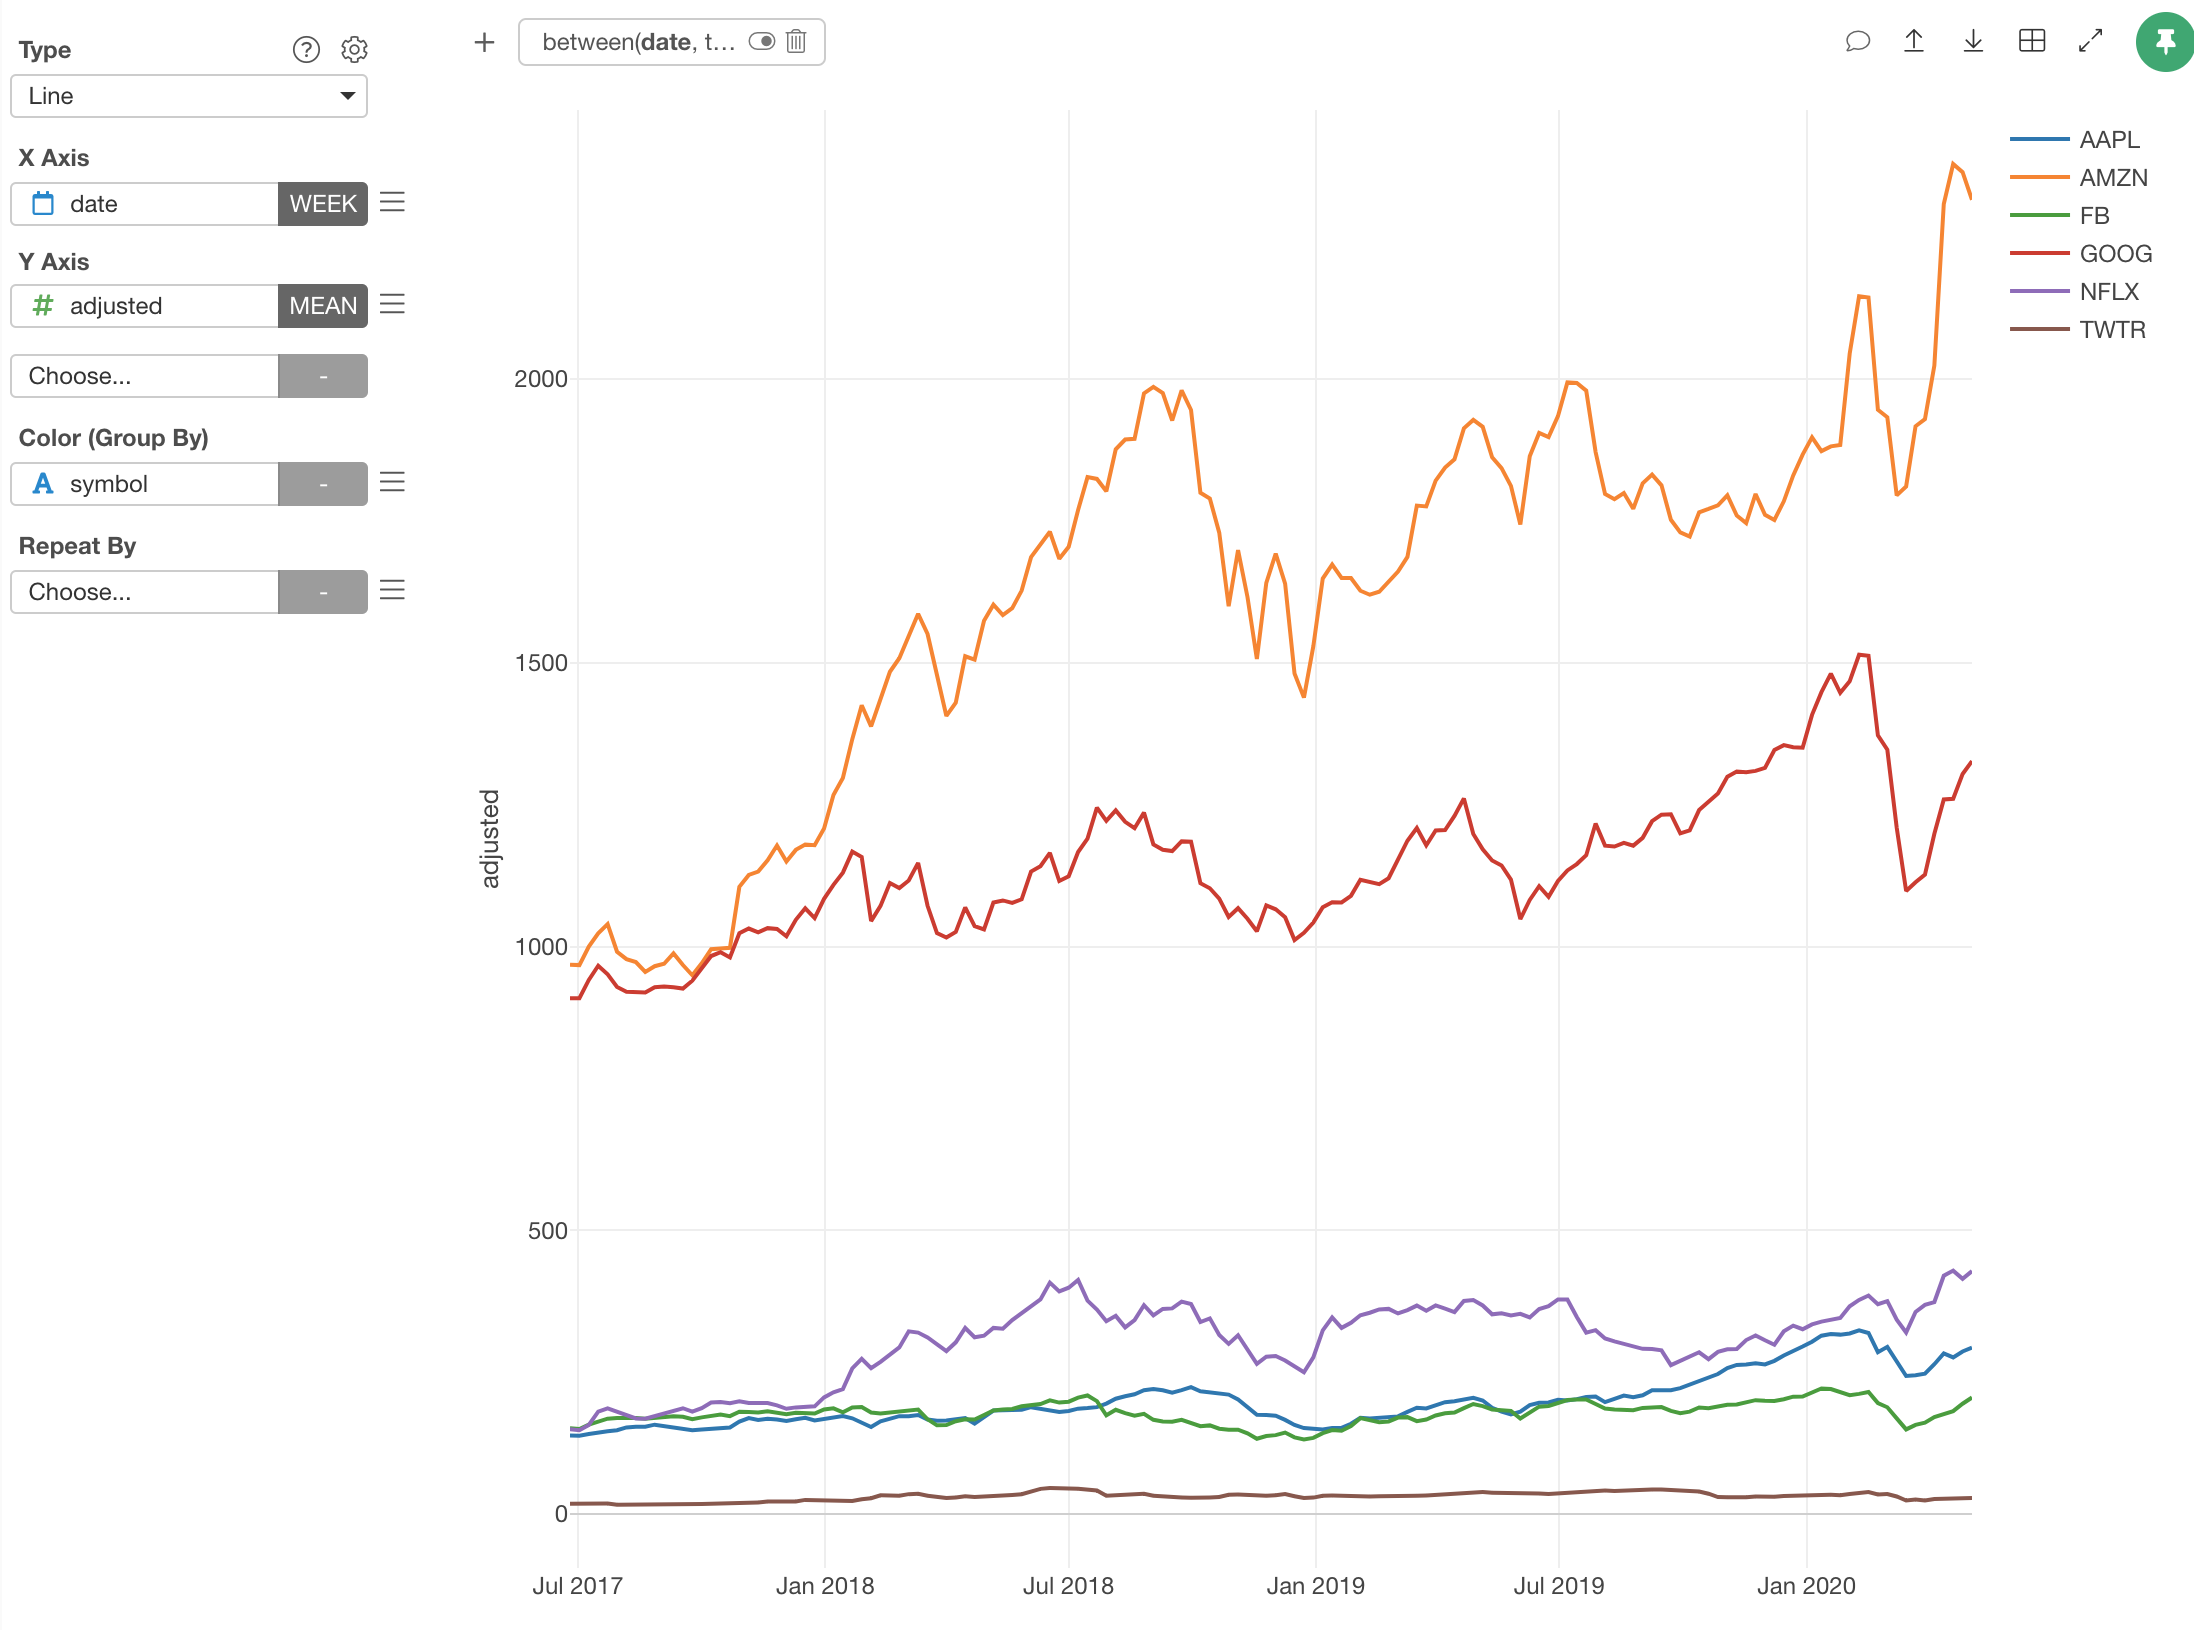
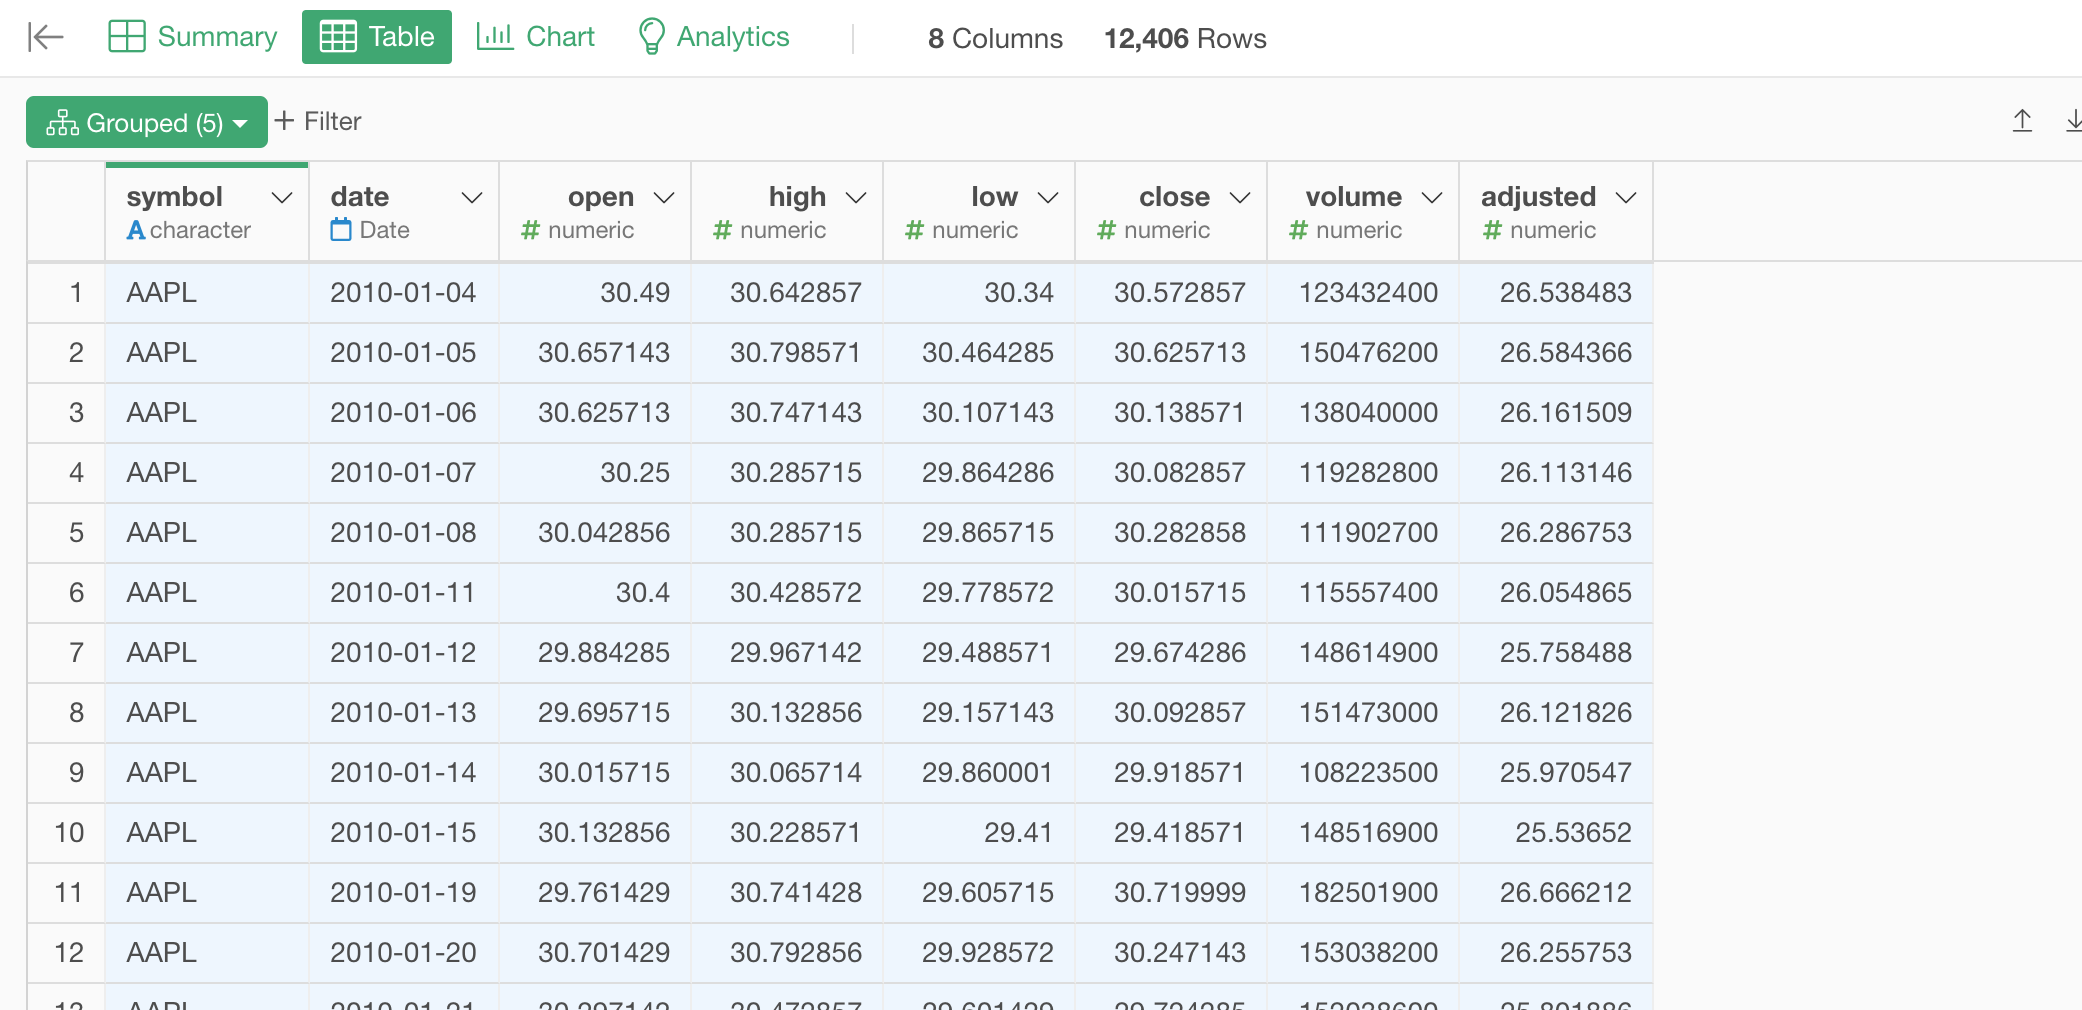
Here’s a stock price data for a few tech companies.
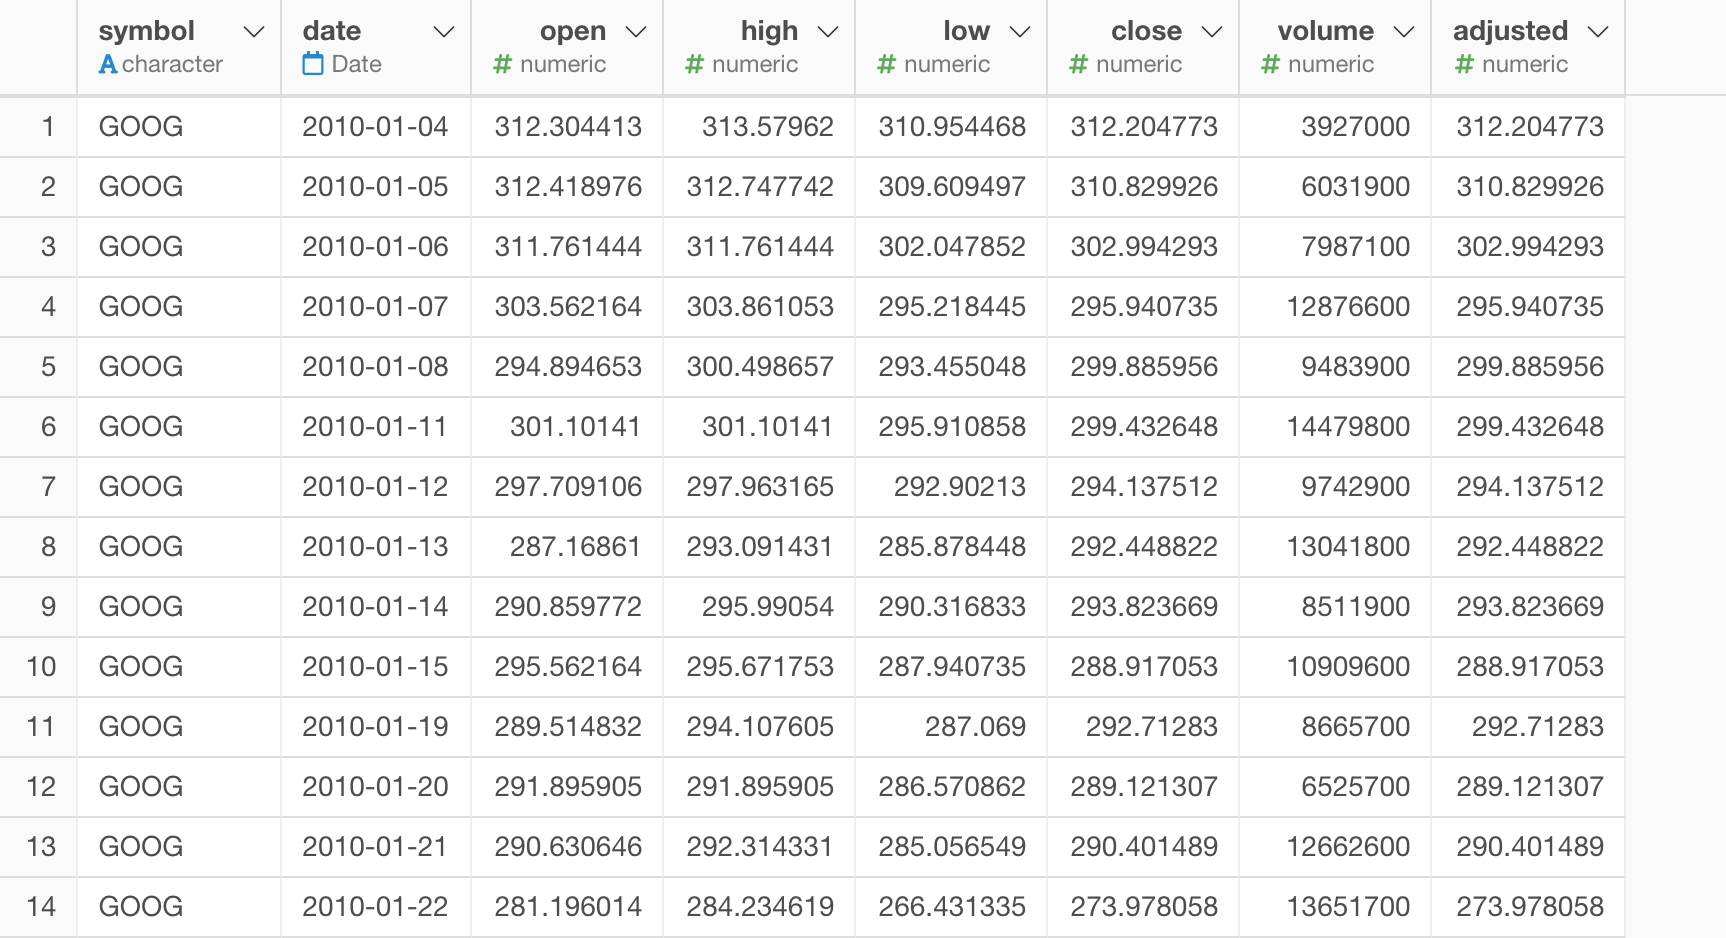
The range of the stock prices are different among the companies.
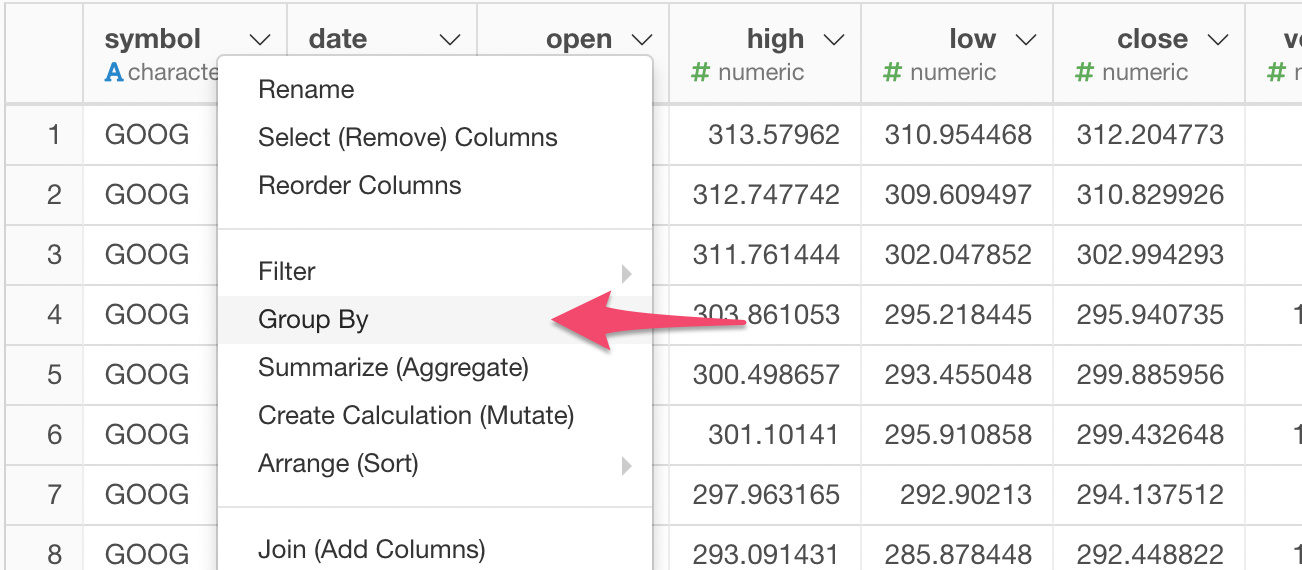
If we want to normalize the stock price for each company you want to group by the data by the ‘symbol’ column first.
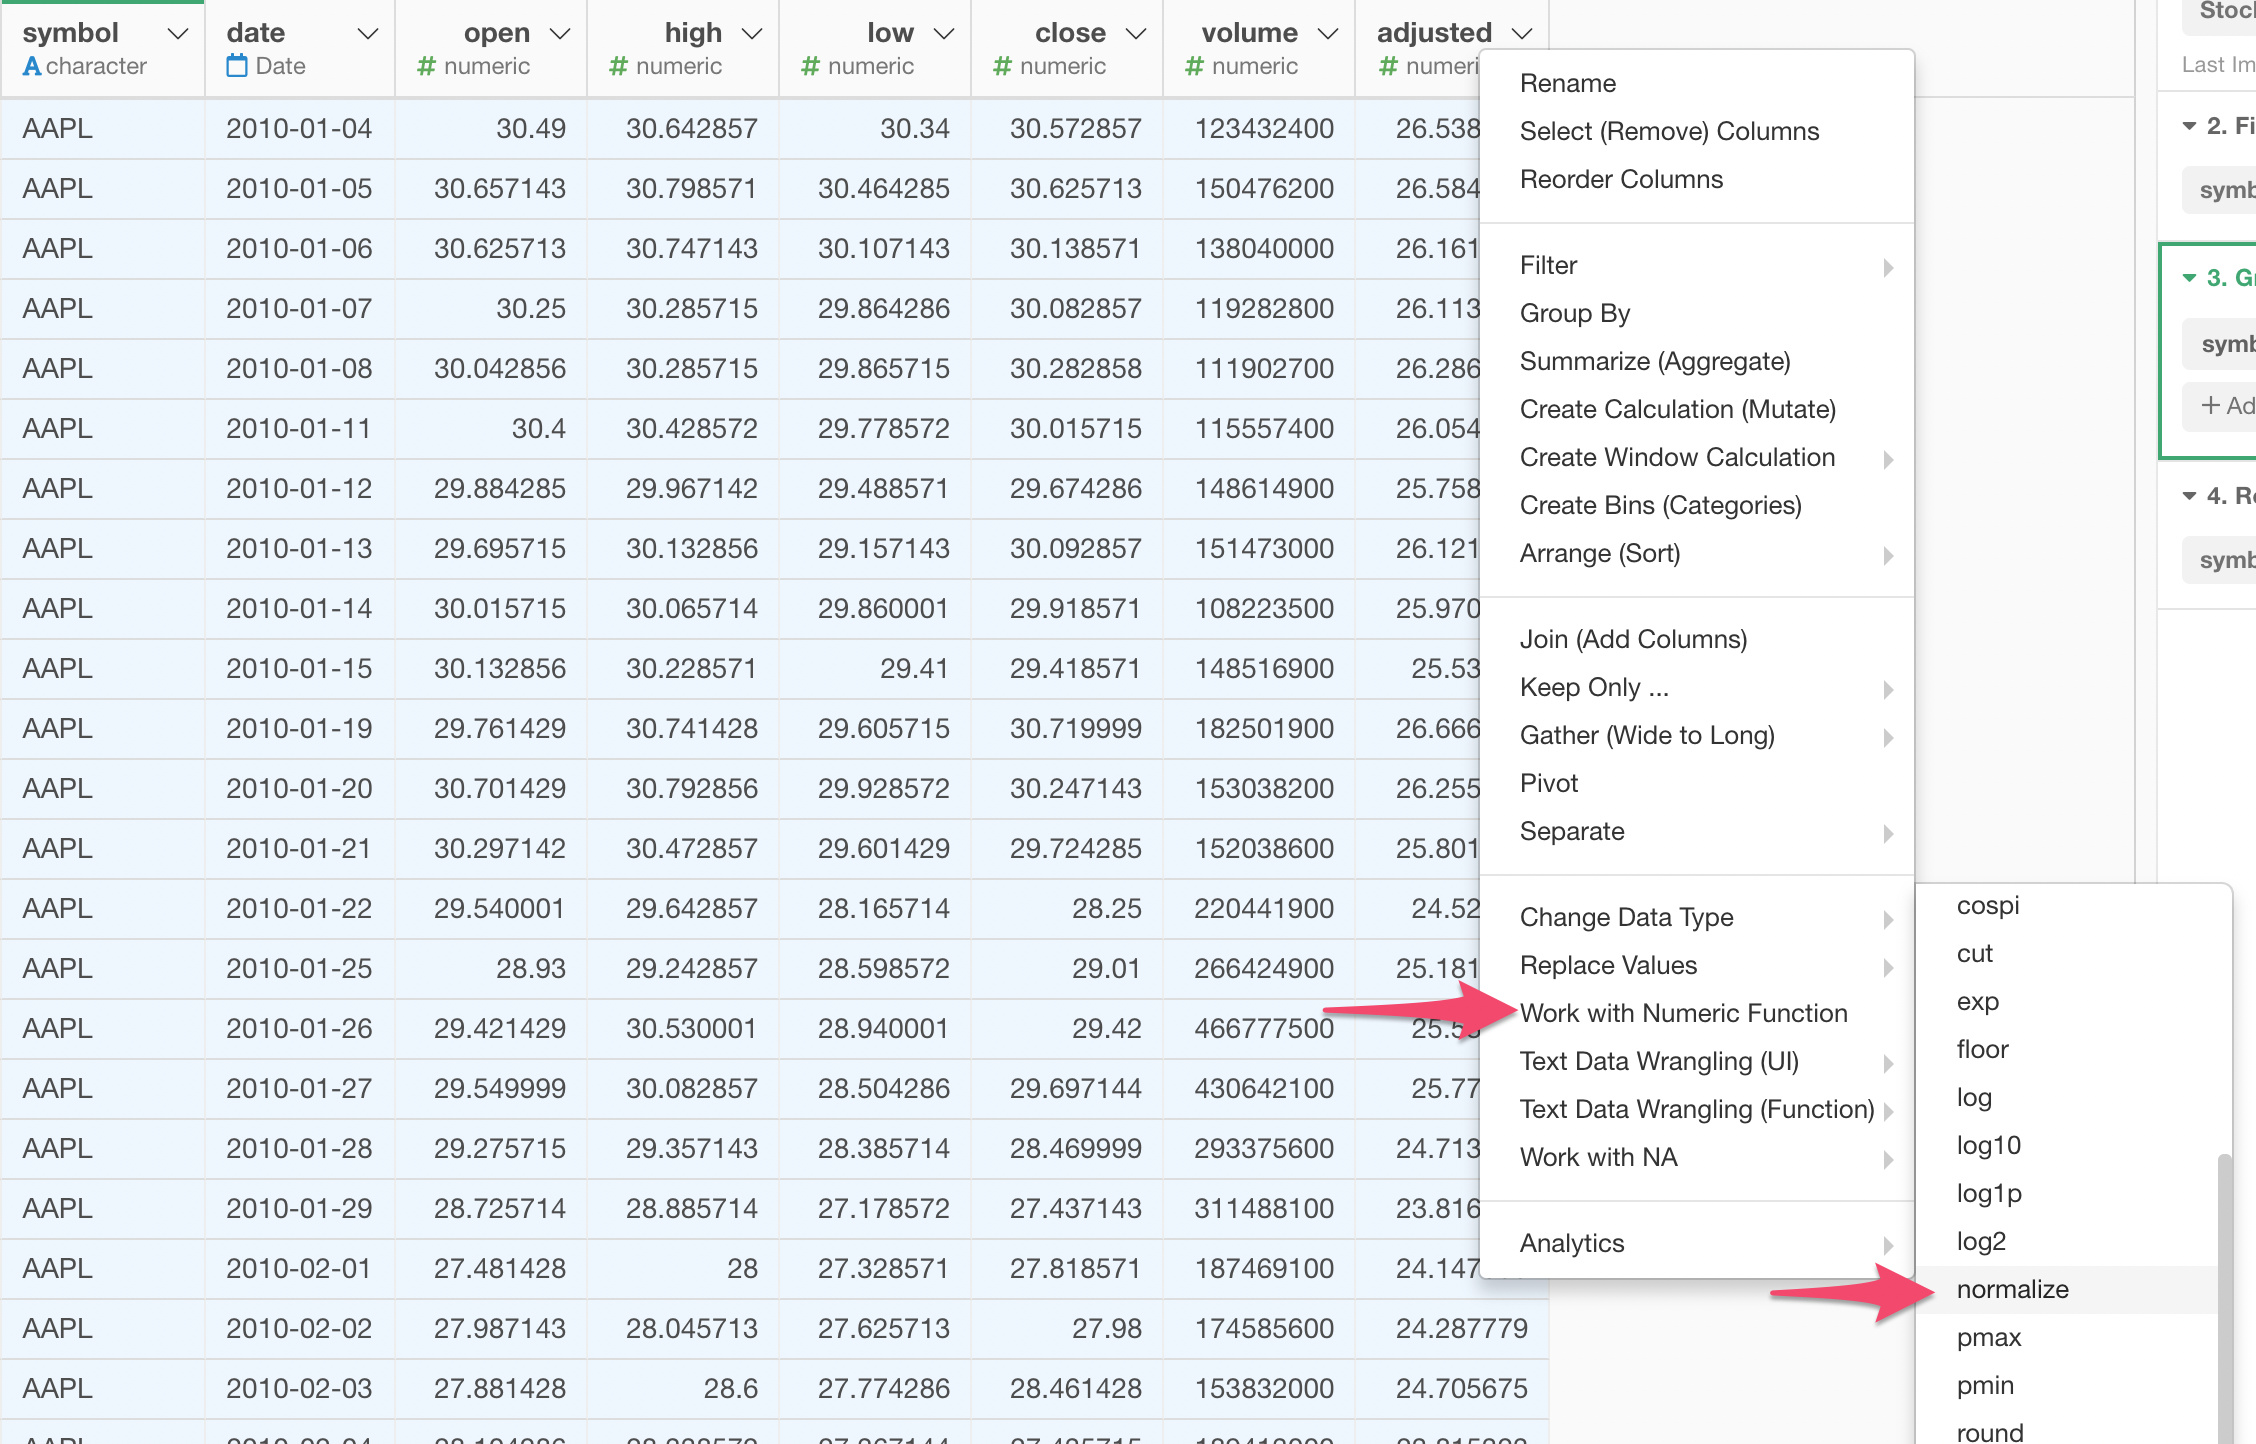
Then, select ‘normalize’ under ‘Work with Numeric Functions’.
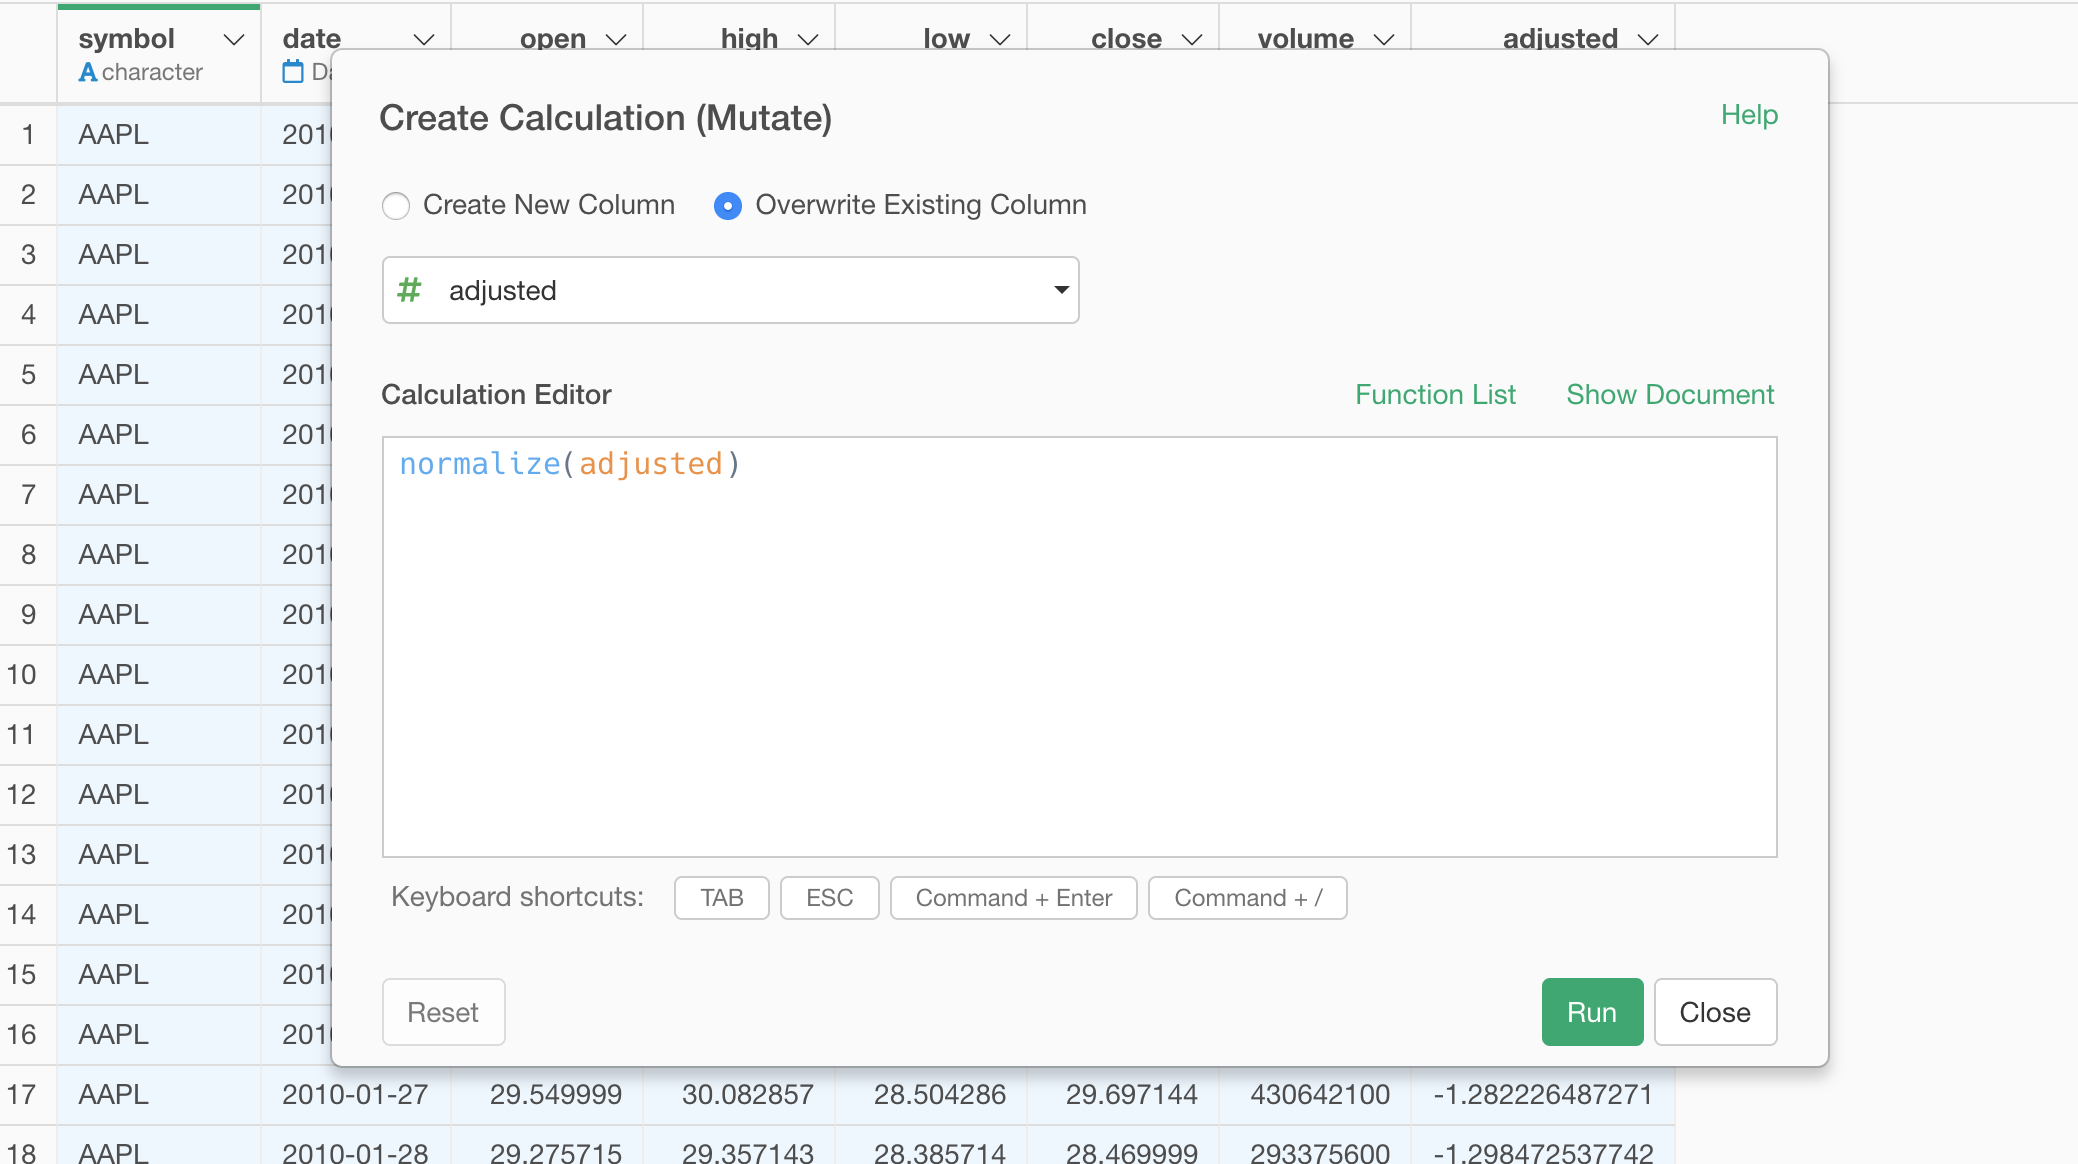
Click the Run button.
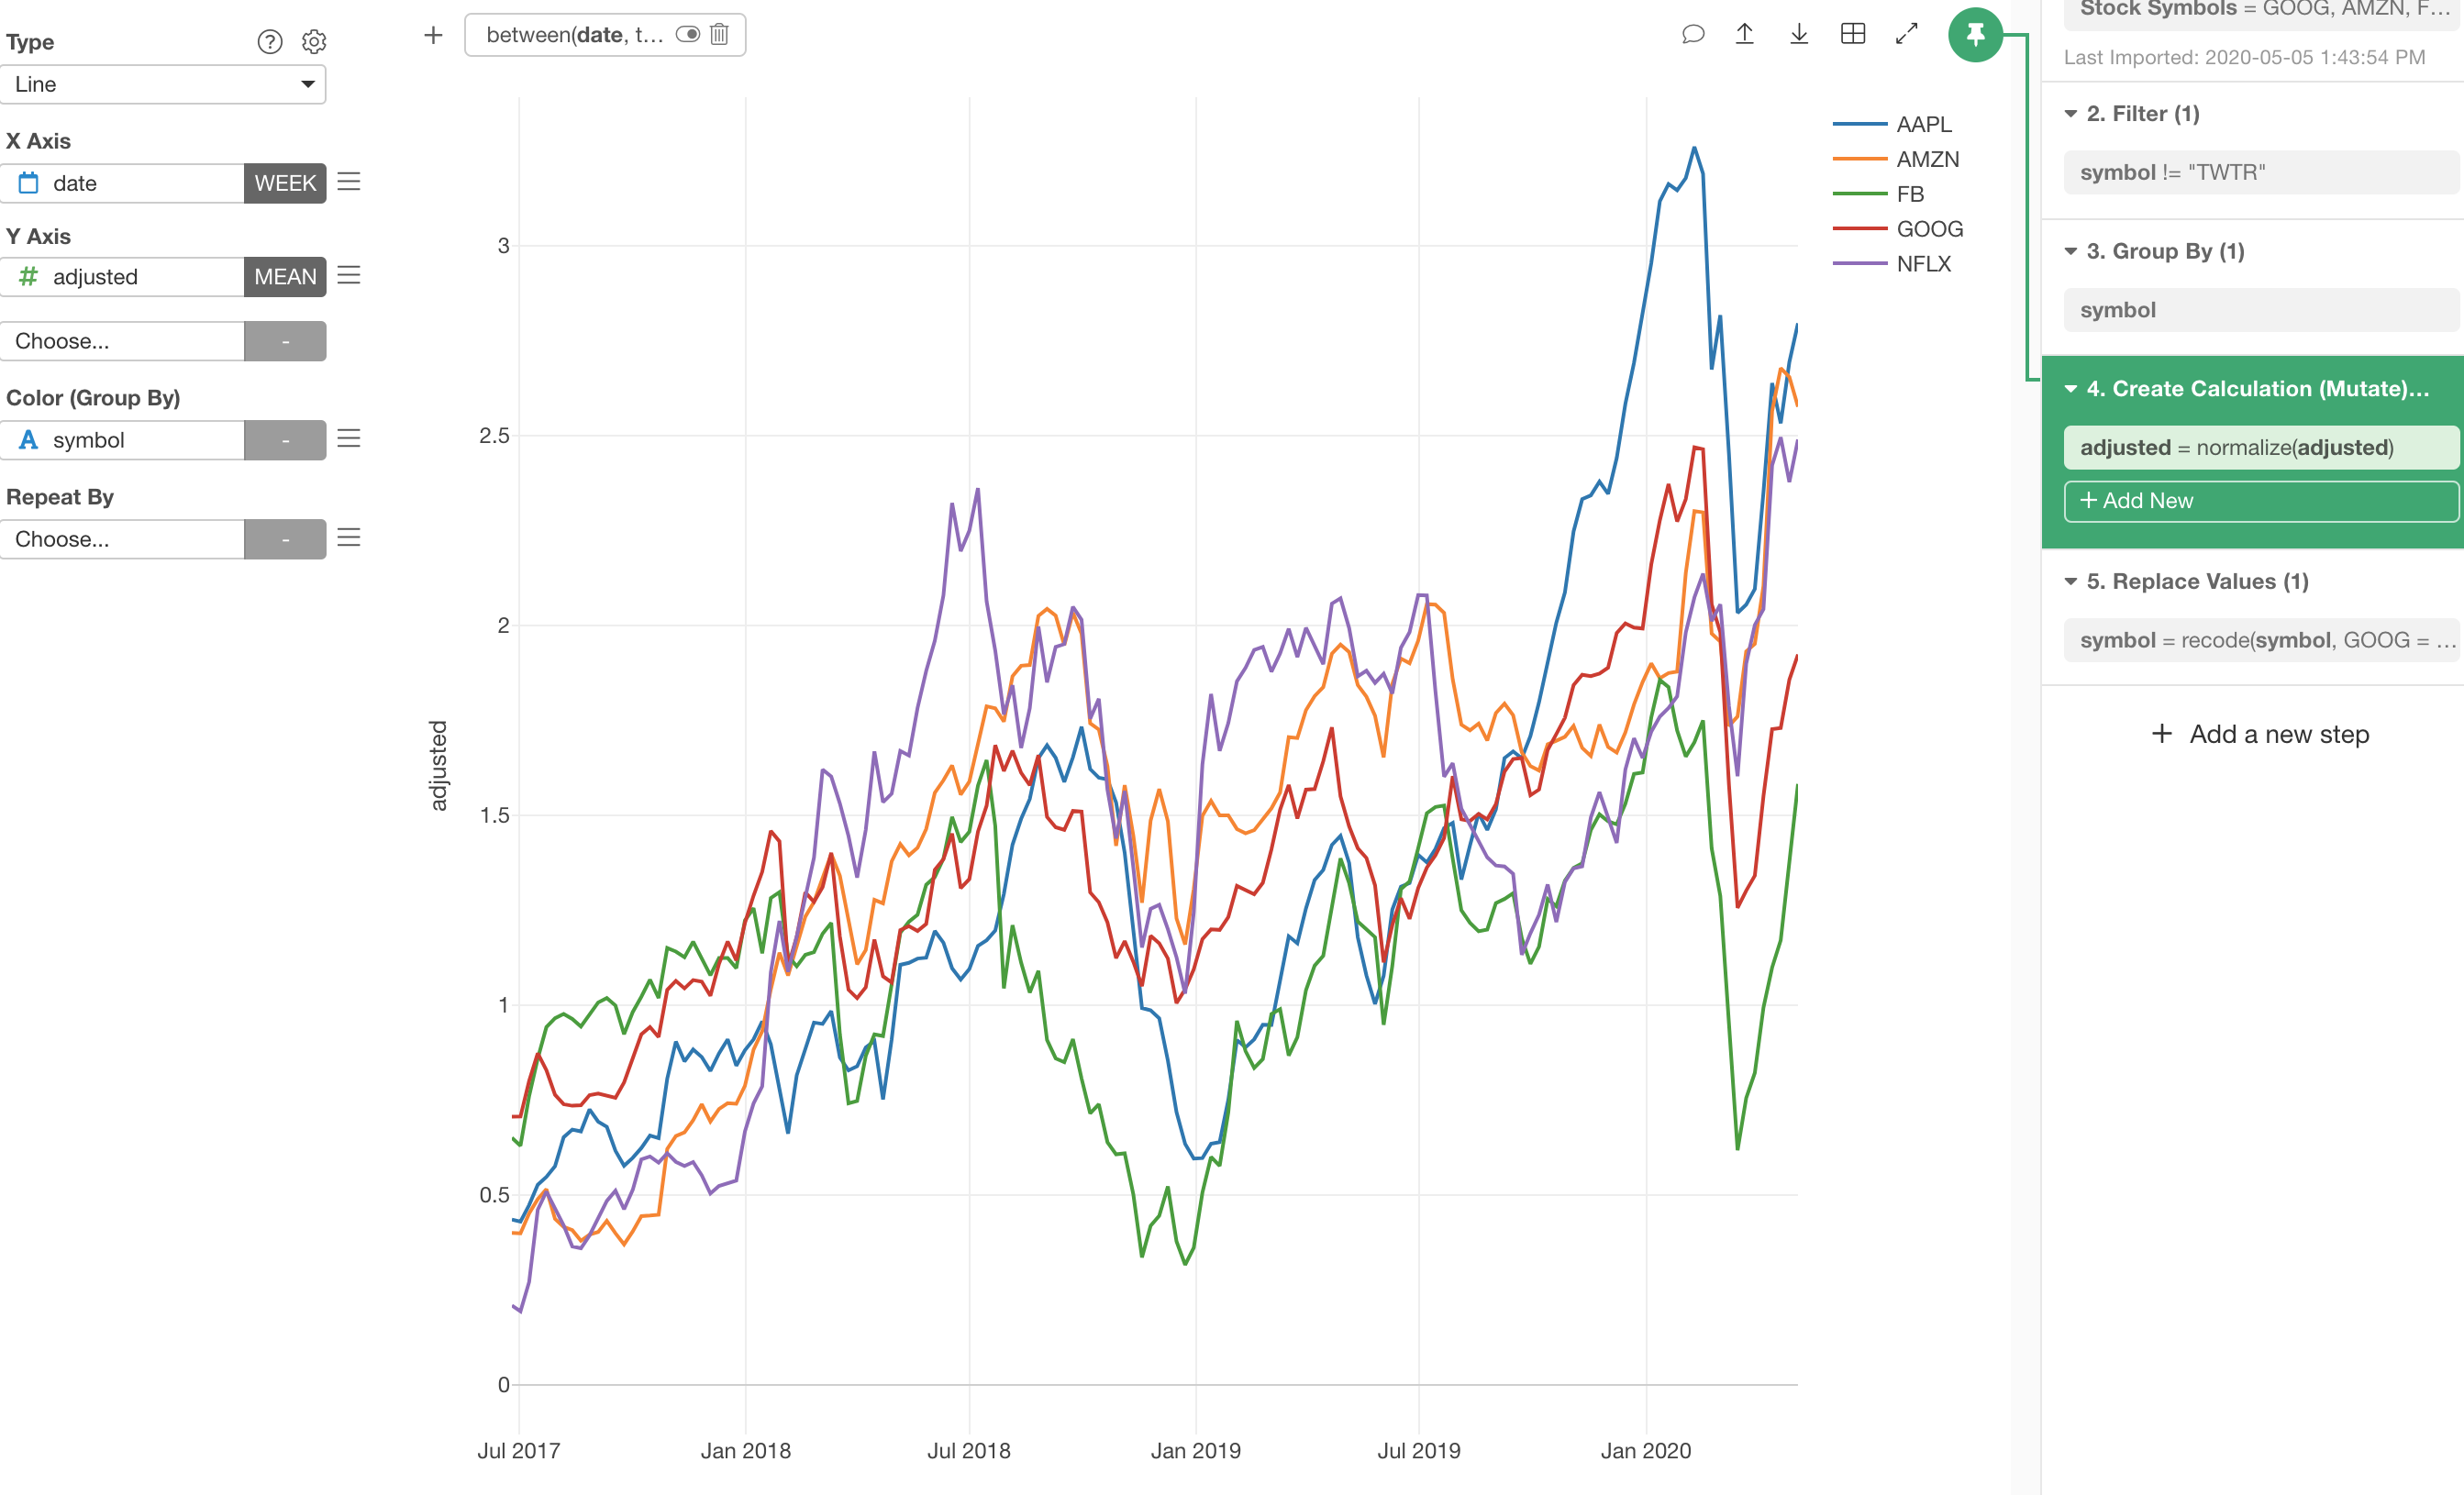
Now the price ranges are similar with the normalized values.