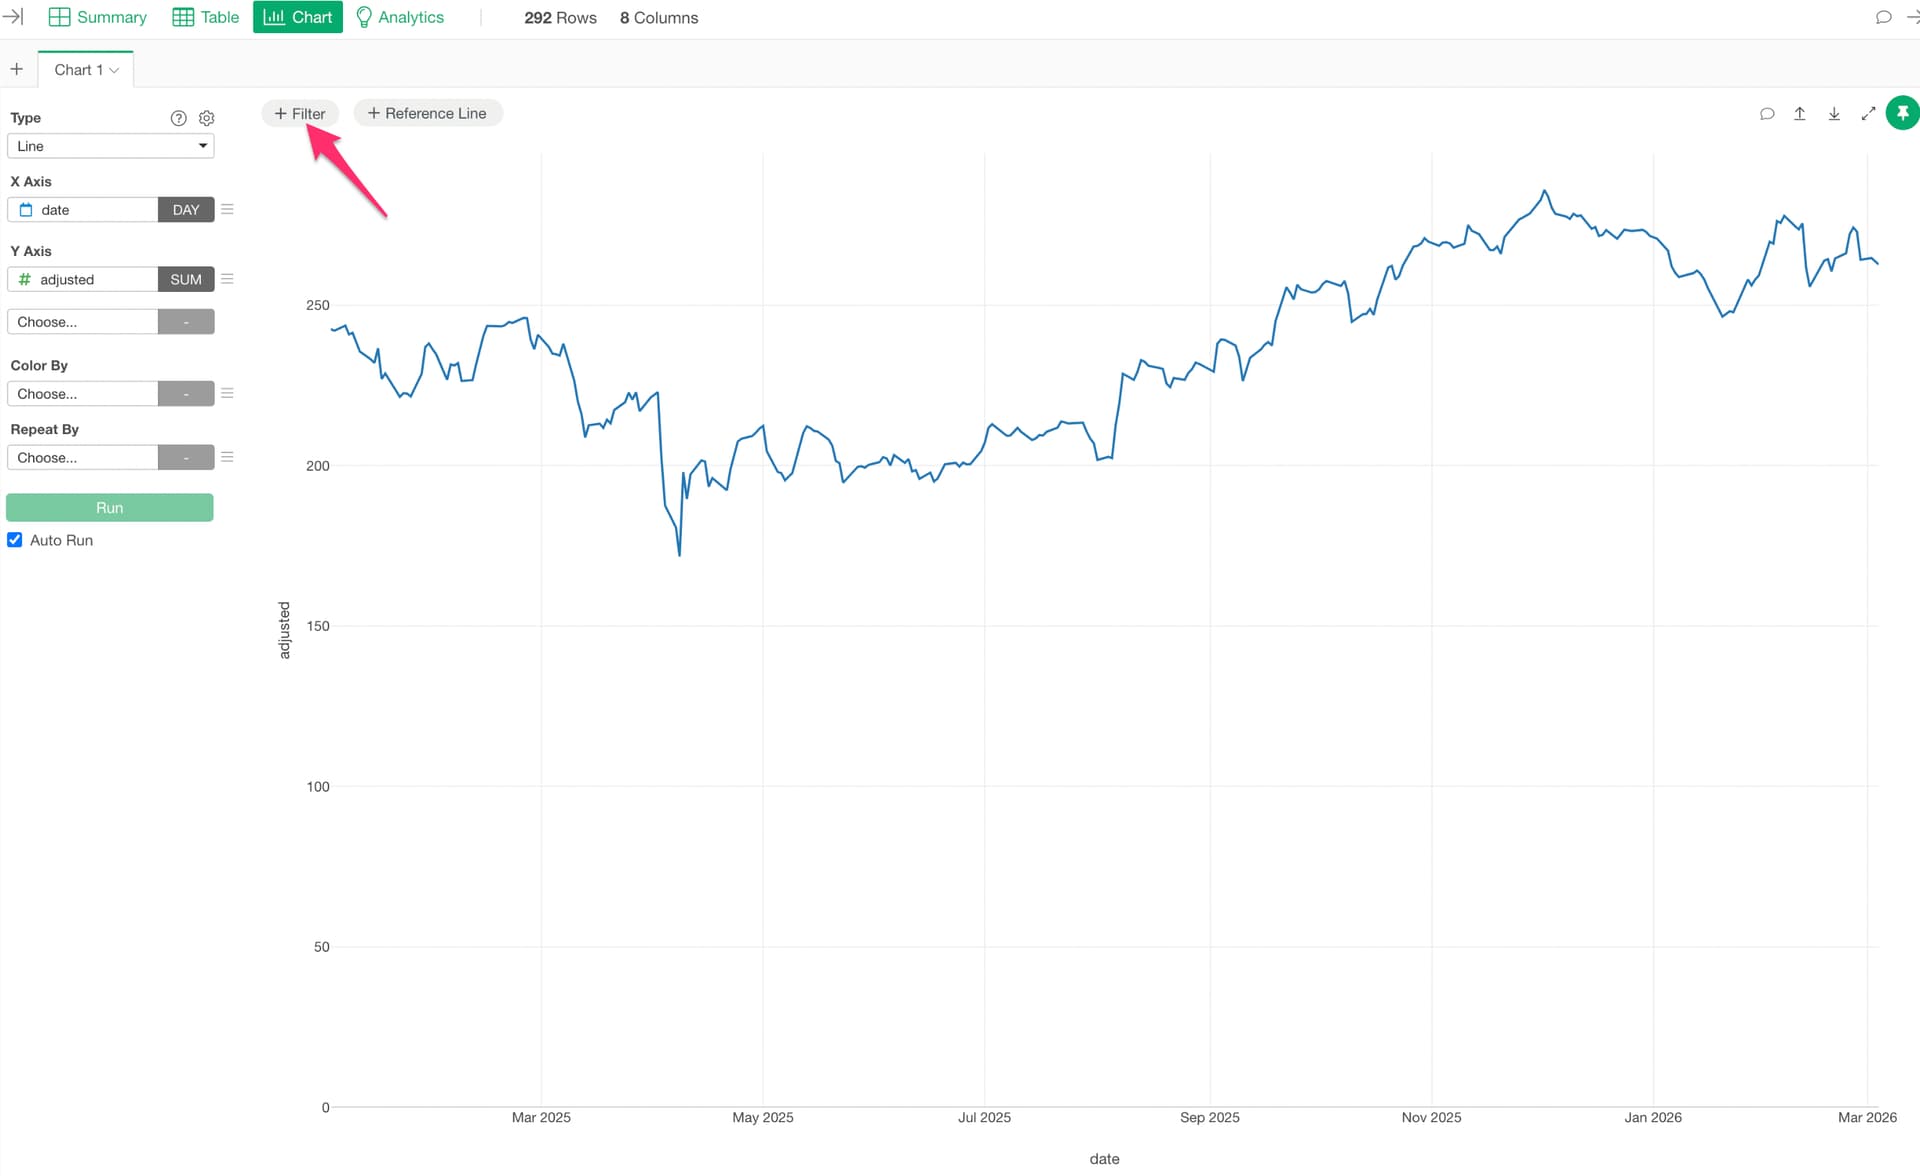
Click + Filter at the top of the chart to open the Chart Filter dialog.
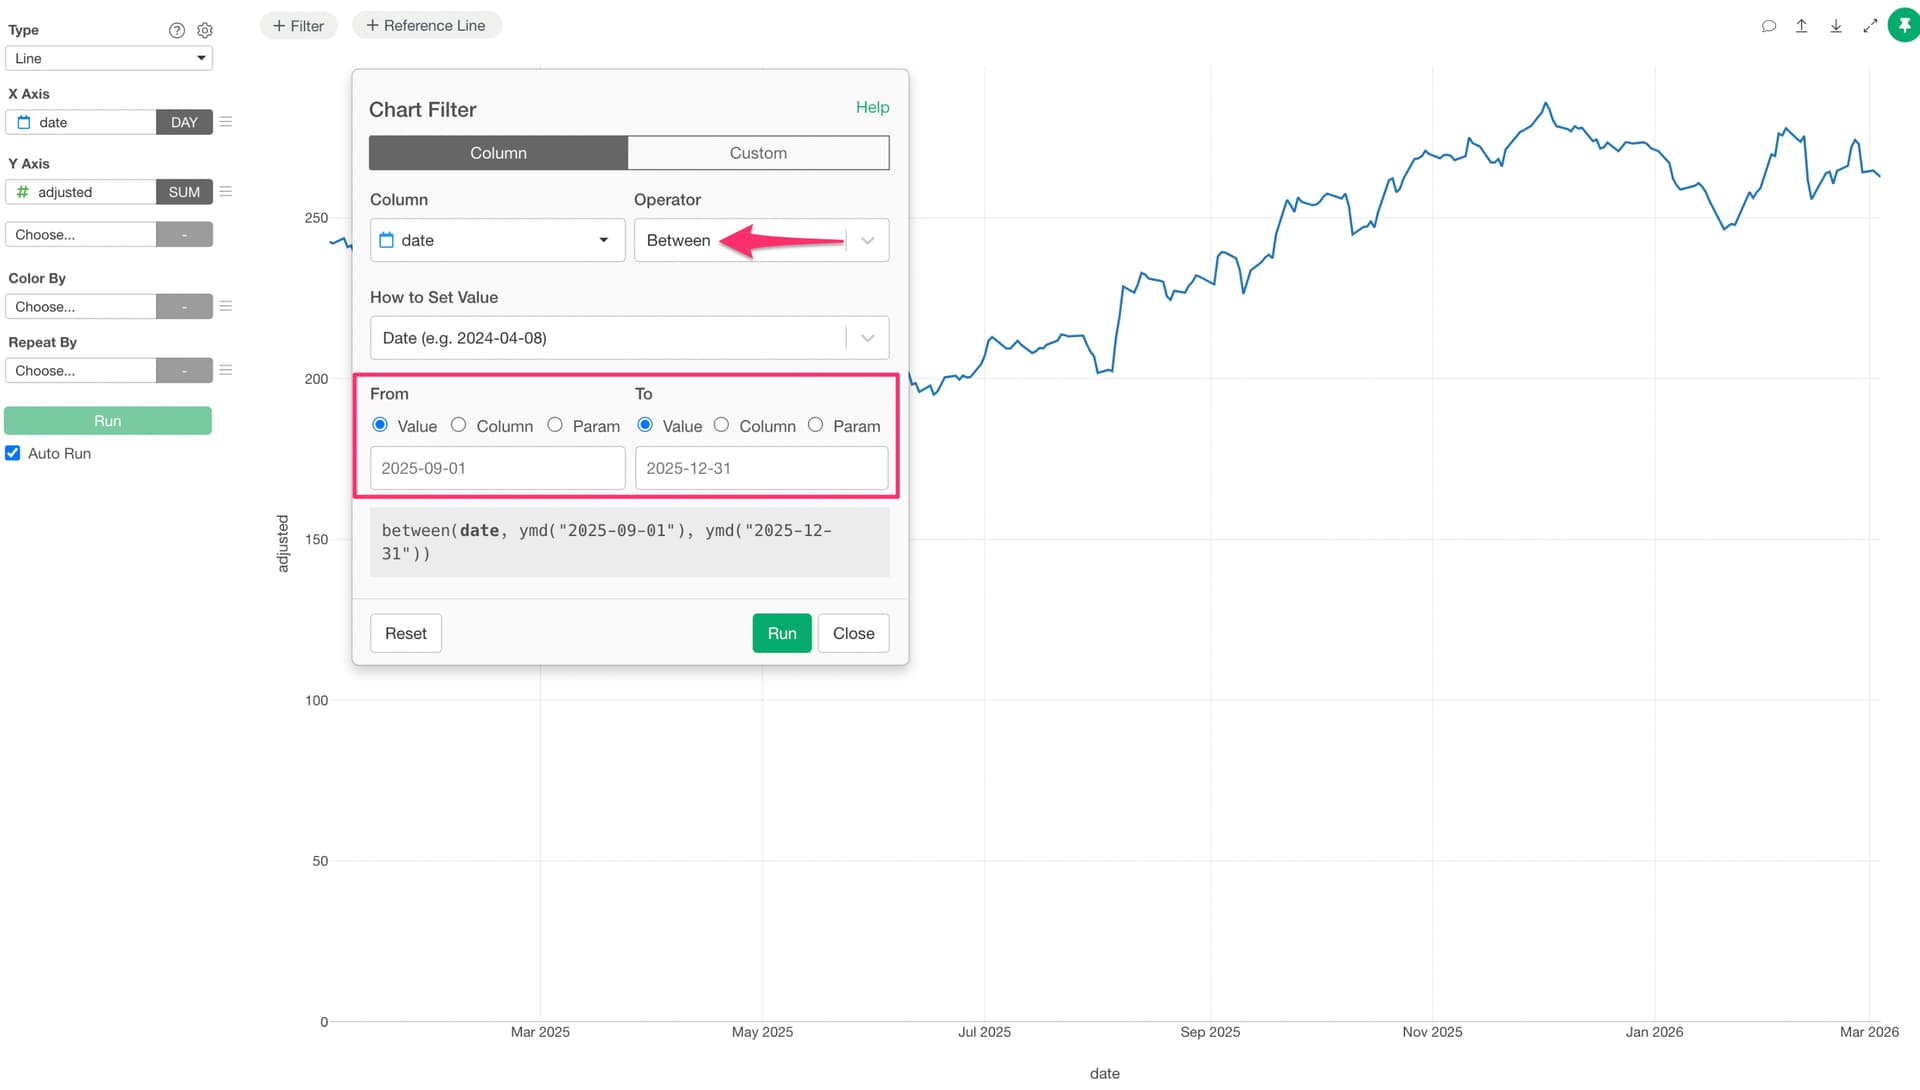
Set the column to your date column and the operator to Between. Enter the start and end dates, then click Run to display only the data within the specified date range in the chart.