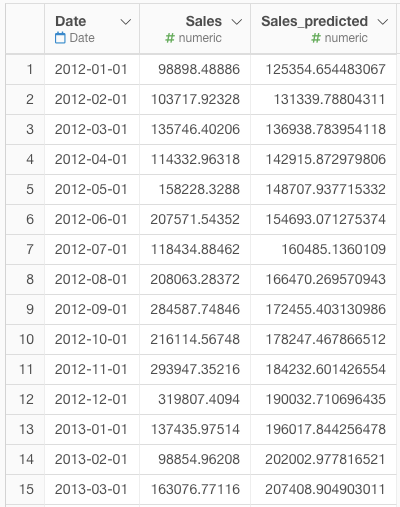
Suppose you have sales data. Each row represents the monthly total sales and it also has the predicted sales value calculated by a certain model.
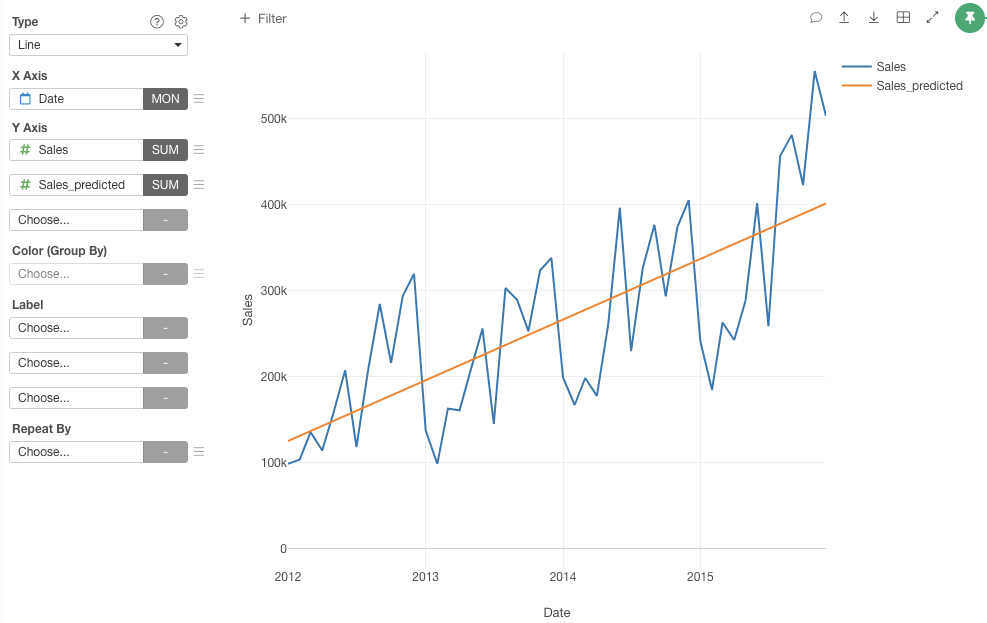
Now, you want to see the model fitting. Here is how.
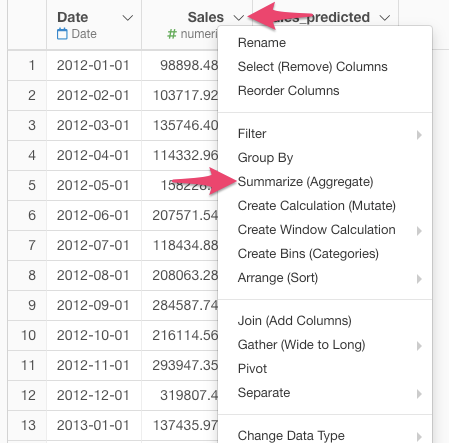
First, from the column header menu of the Sales column, select “Summarize (Aggregate)”.
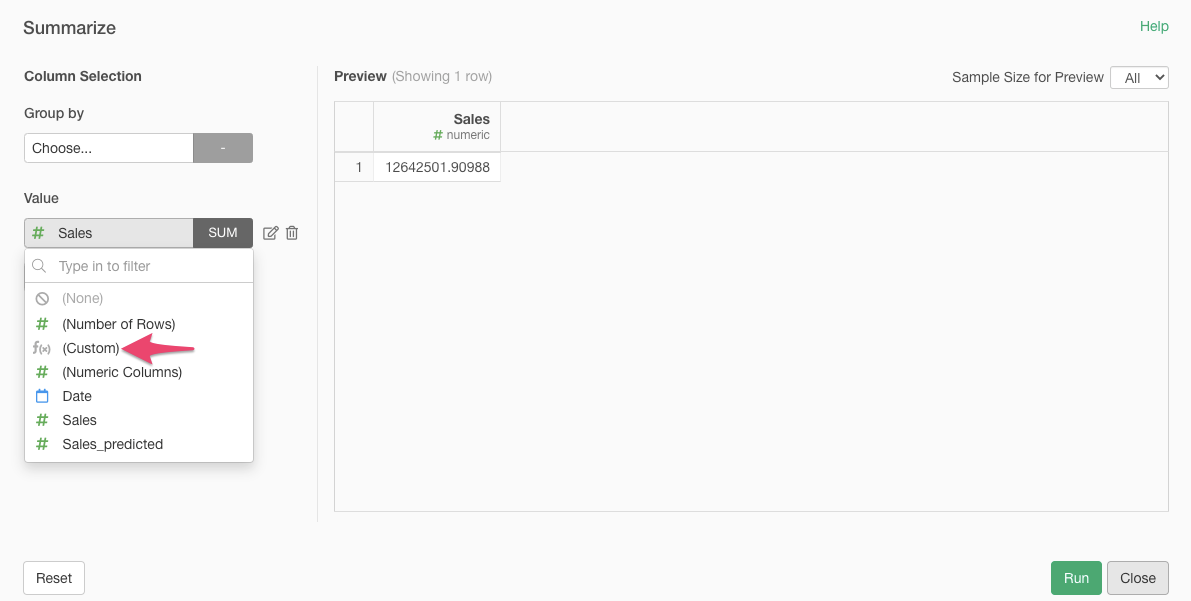
It opens the Summarize dialog. At the Value, select “(Custom)”.
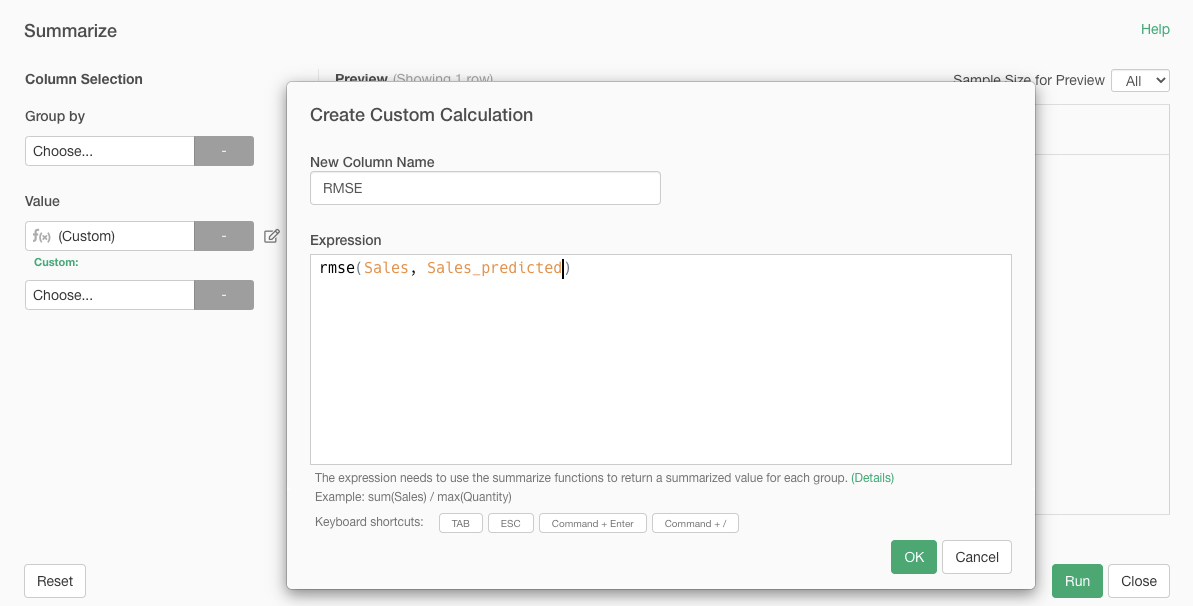
It opens the “Create Custom Calculation” dialog. Here, we use Root Mean Square Error (RMSE) to check the model fitting. You can use the function rmse from the Exploratory package for this purpose.
- Type in “RMSE” for the “New Column Name”.
- Type in the following expression in the “Expression” field.
- Click “OK”
rmse(Sales, Sales_predicted)
Click “Run” button.
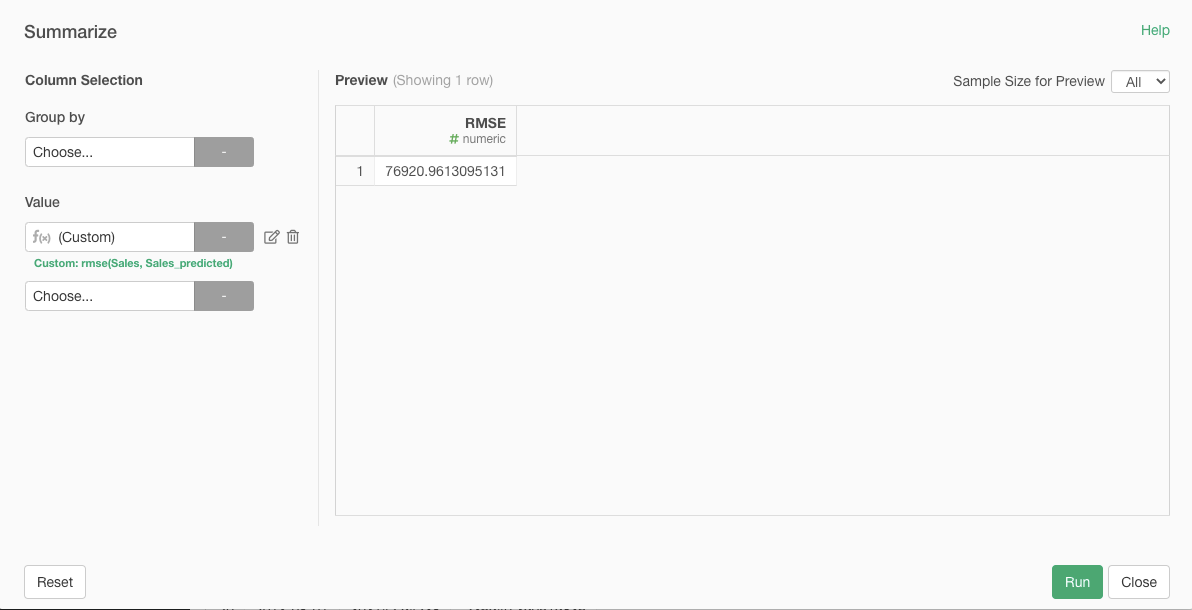
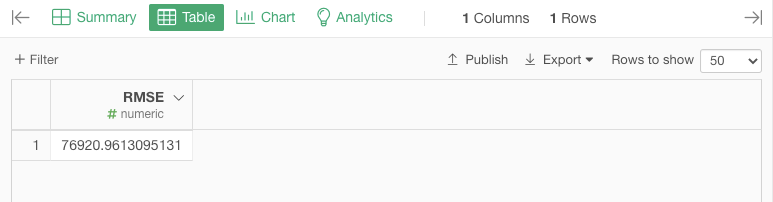
Now, you get the RMSE value.
You can also use the following functions for checking the model fitting.
-
mae: Mean Absolute Error (MAE) -
mape: Mean Absolute Percentage Error (MAPE)
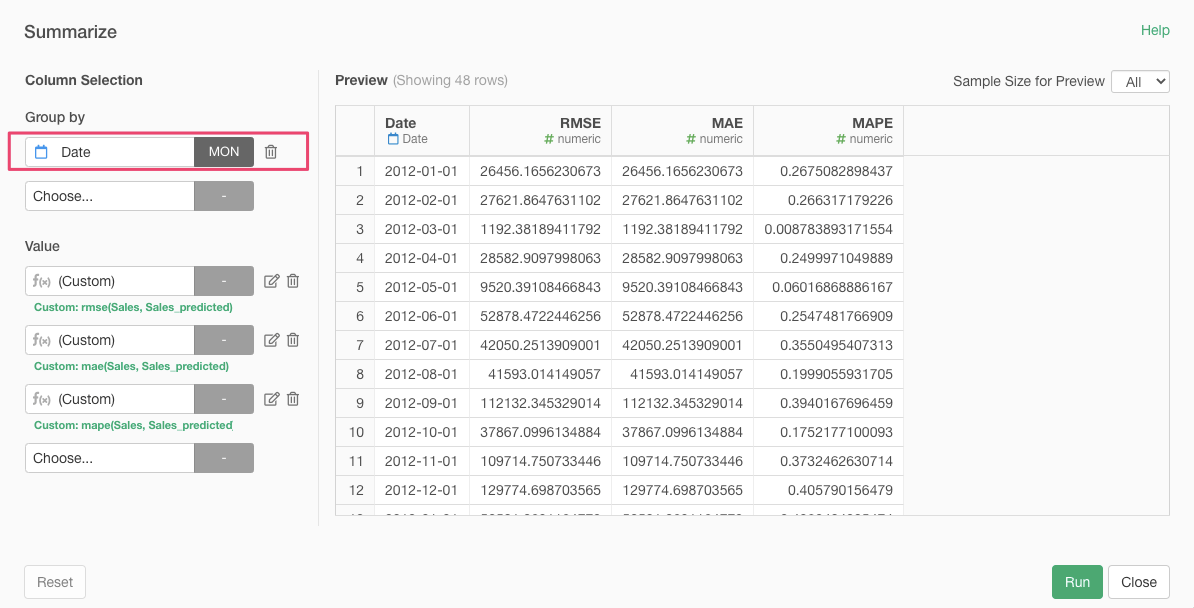
You can add more Value columns in the Summarize dialog like the following to calculate those functions at once.

If there are models for each month and you want to see the model fit for each month, you can add Date column to the “Group By” and select “Round: Month” for the function in the Summarize dialog.