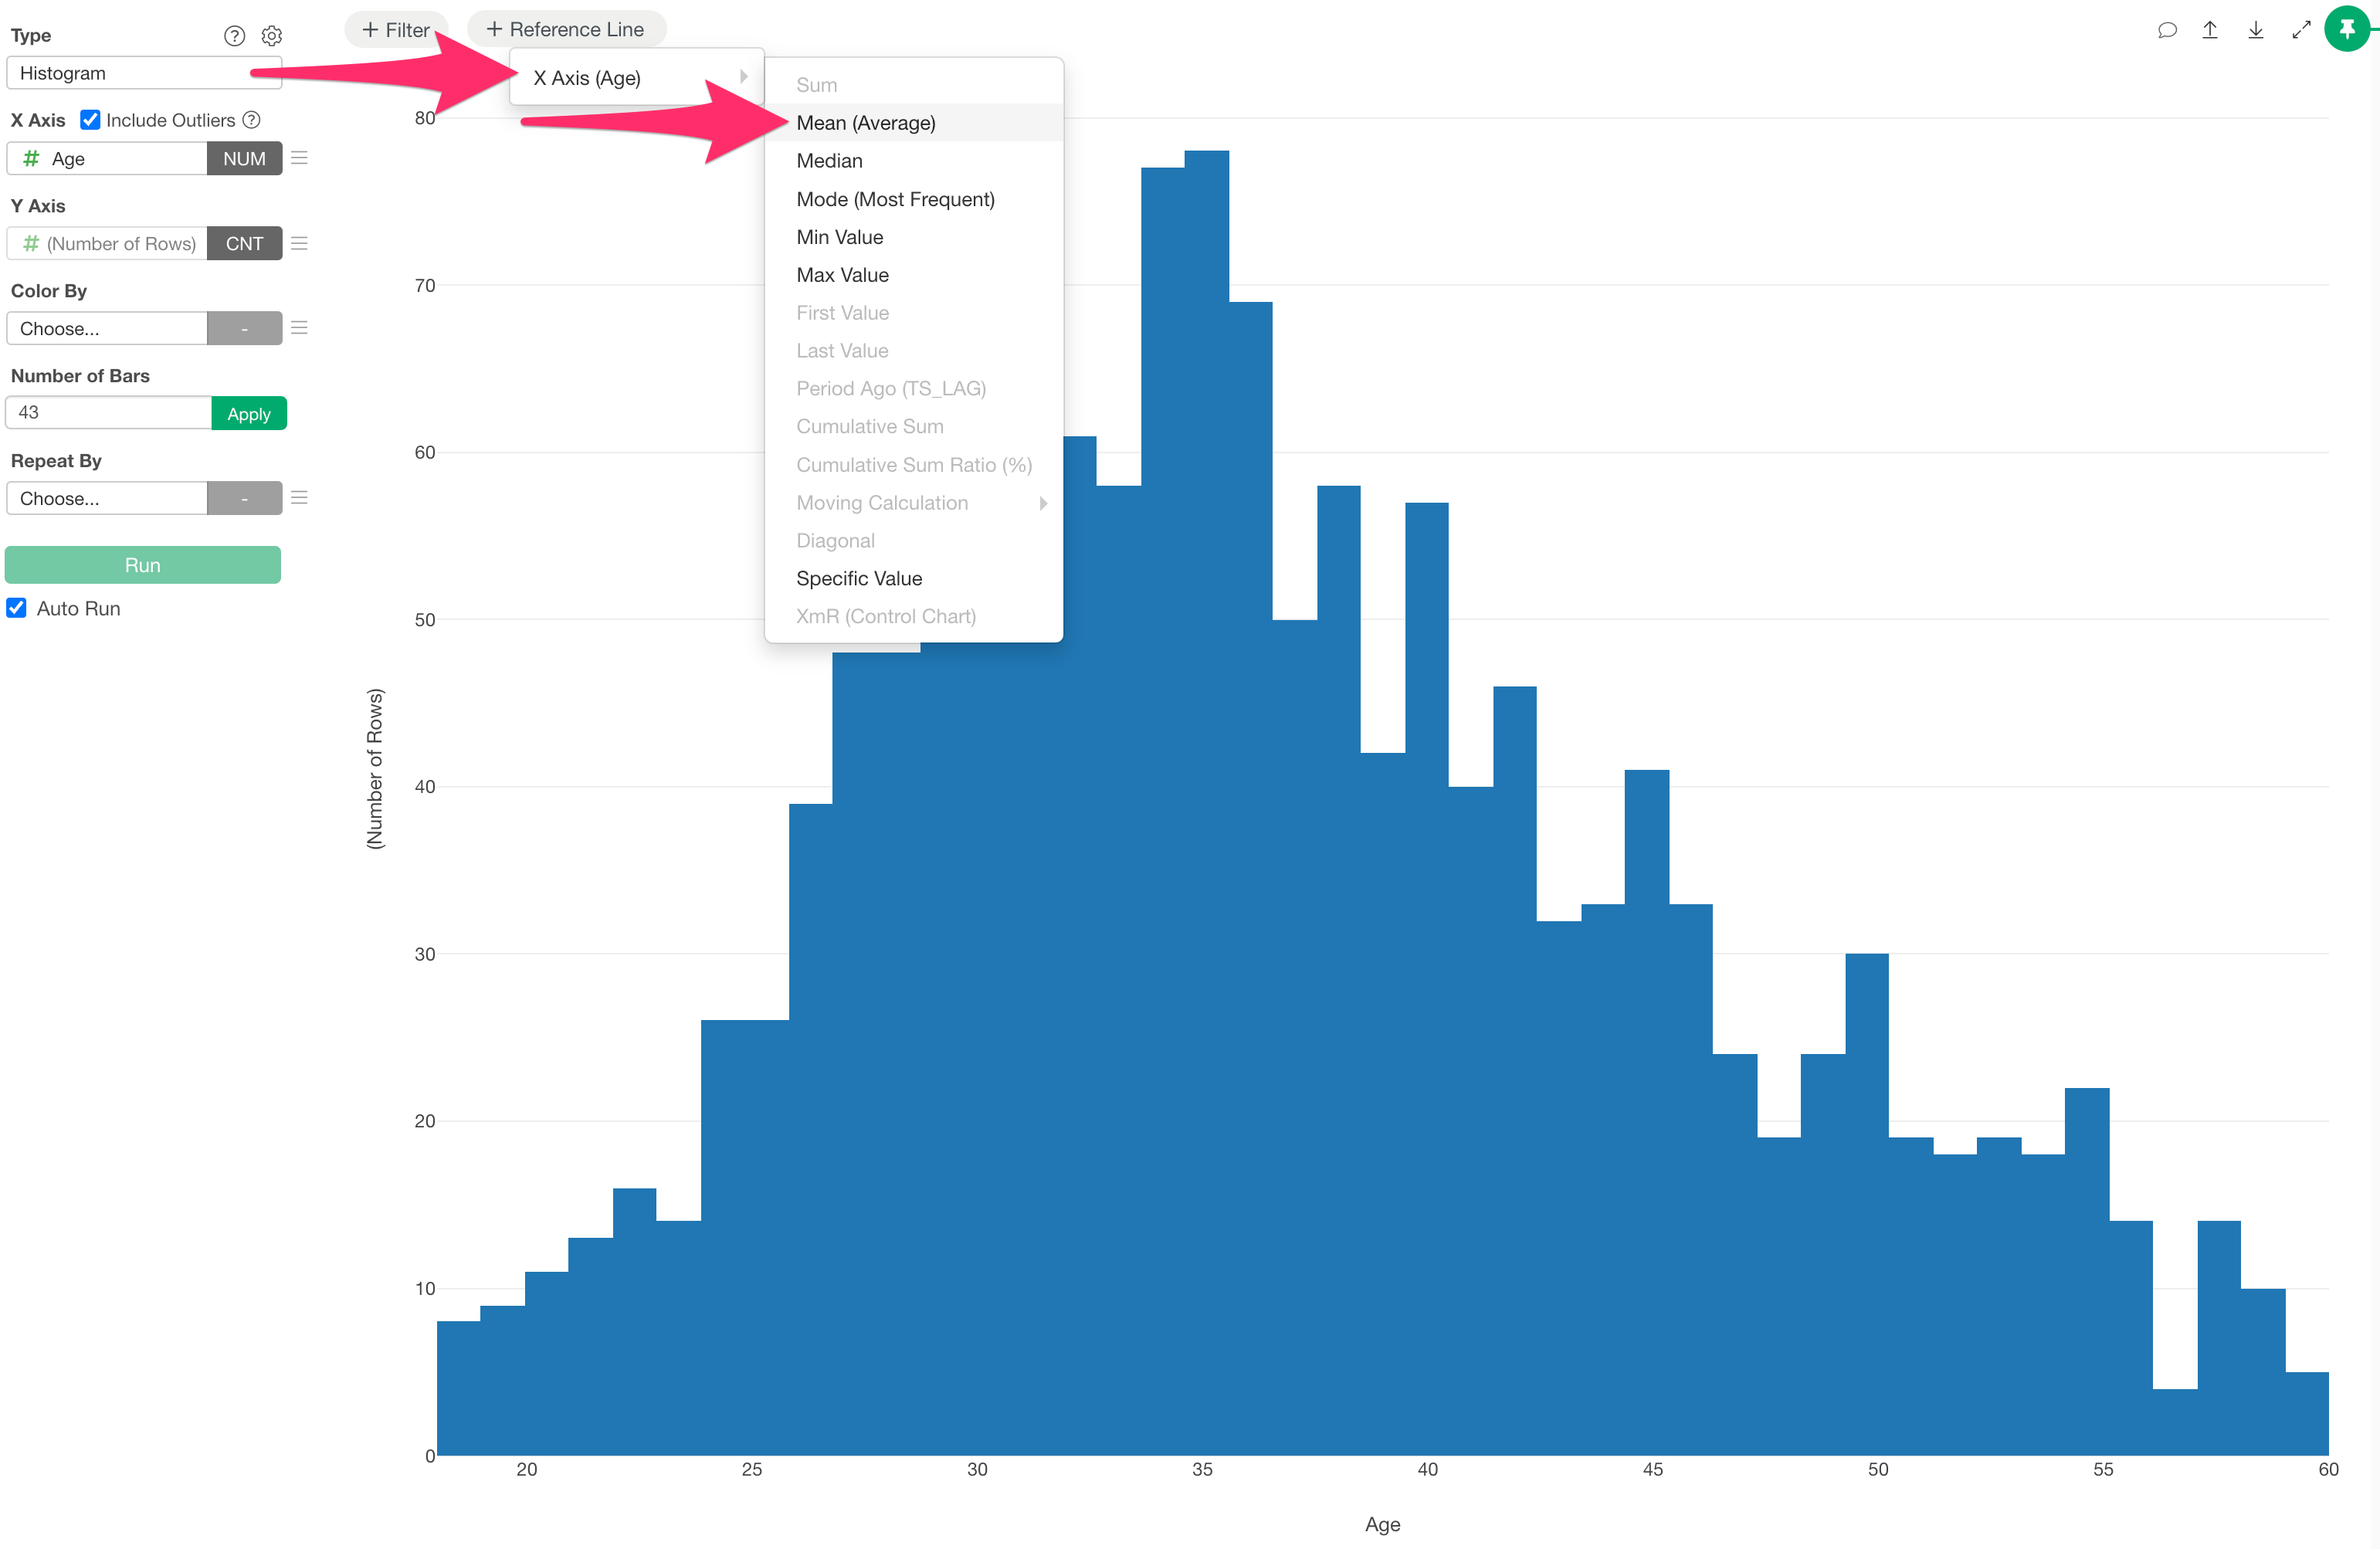
As shown below, suppose you select a numeric column for the X-axis in a bar chart and display all values, then draw a reference line for the average of the values on the X-axis.
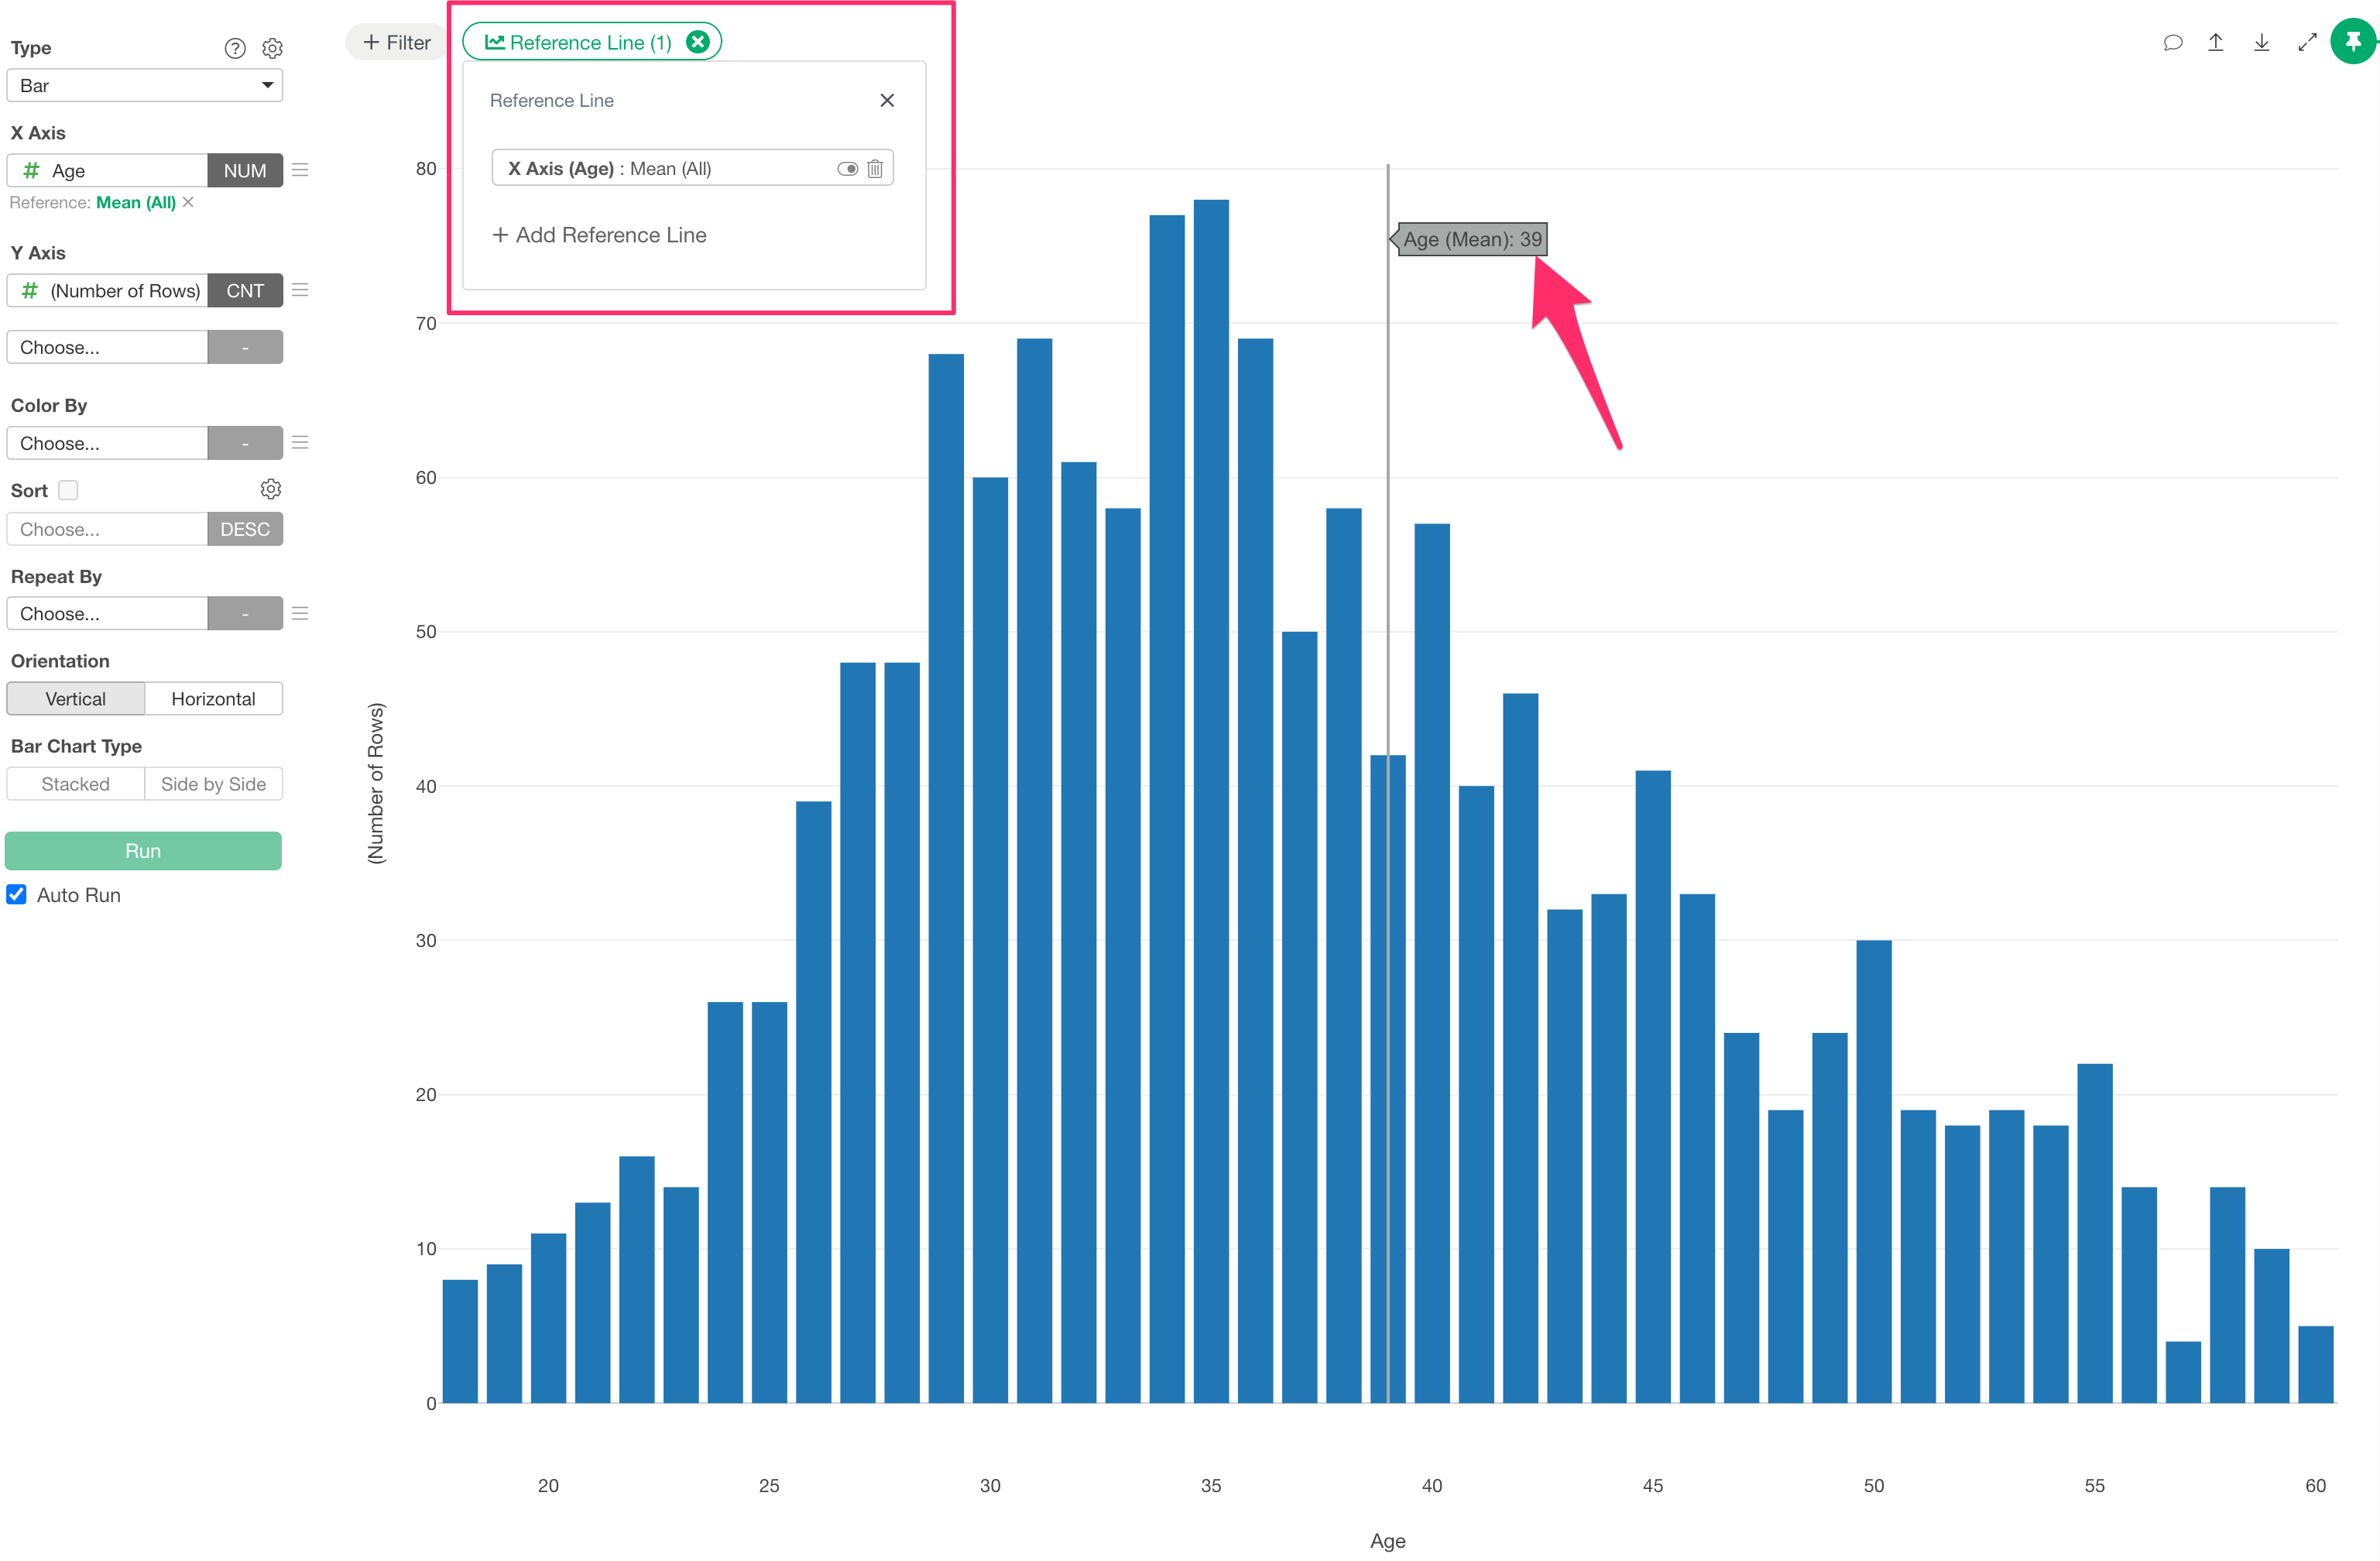
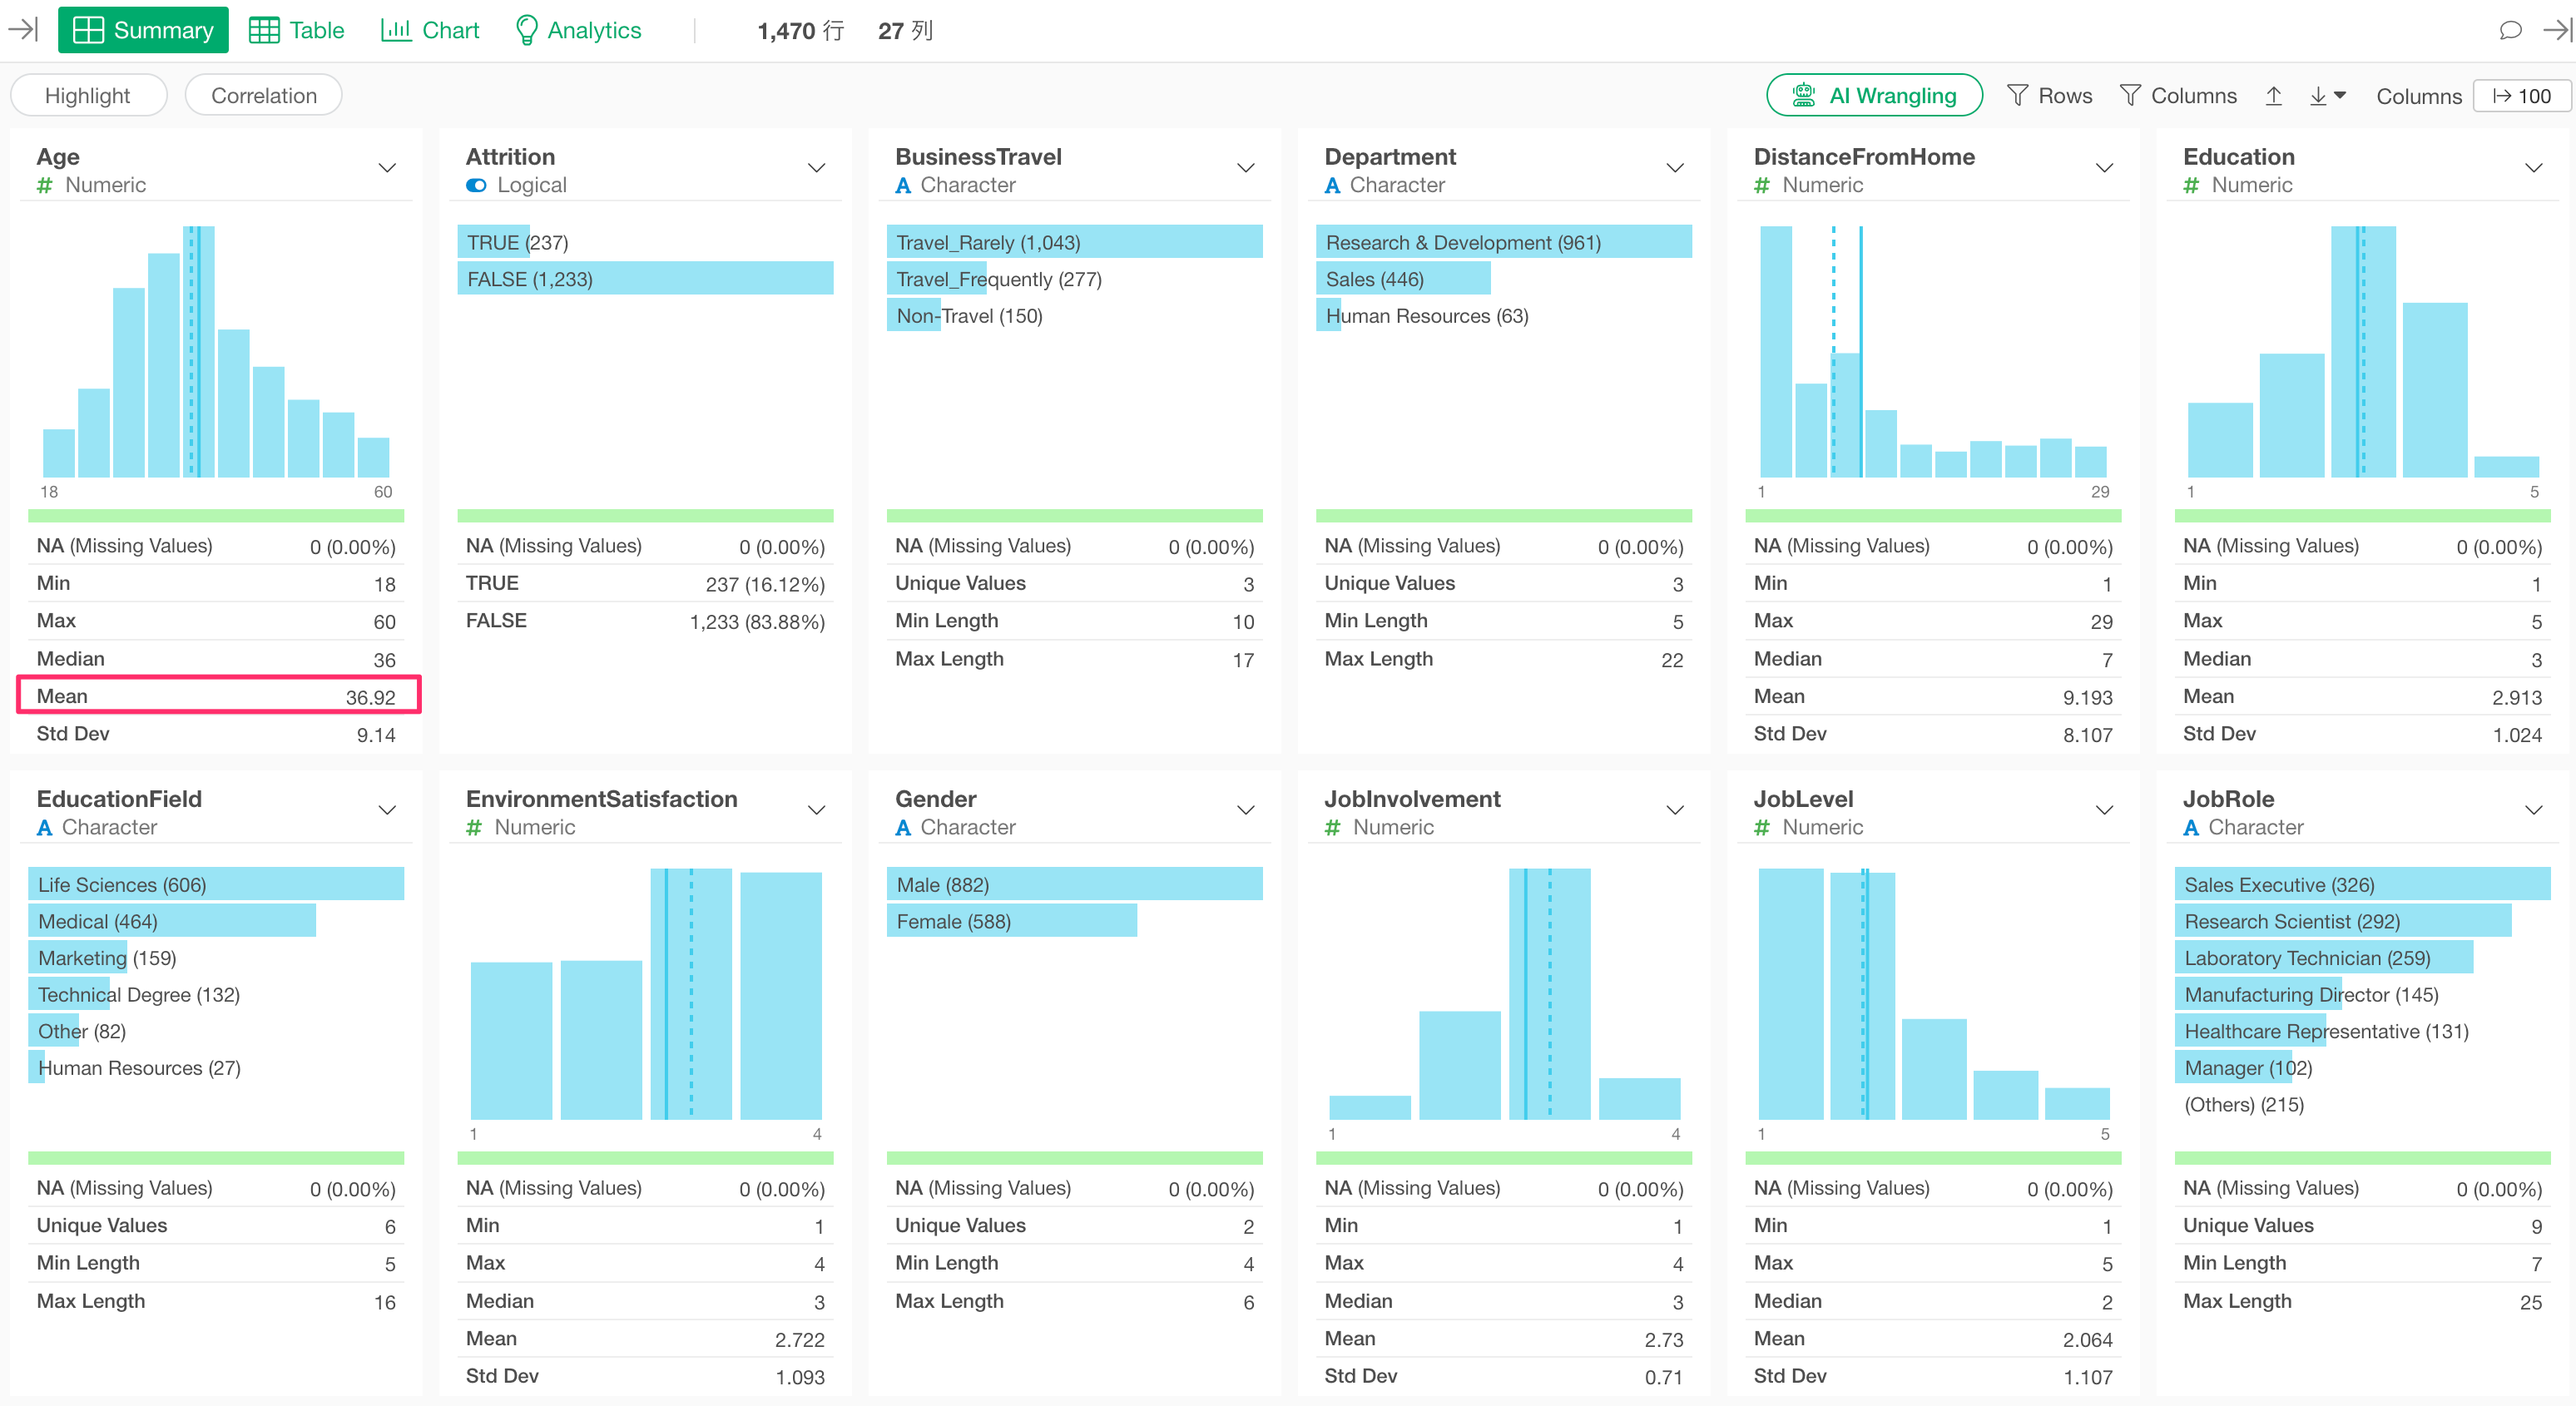
The average reference line shown on the X-axis in the chart above is different from the value obtained by averaging all values in the selected column.
Specifically, the reference value is calculated as the average of the values currently displayed on the X-axis.

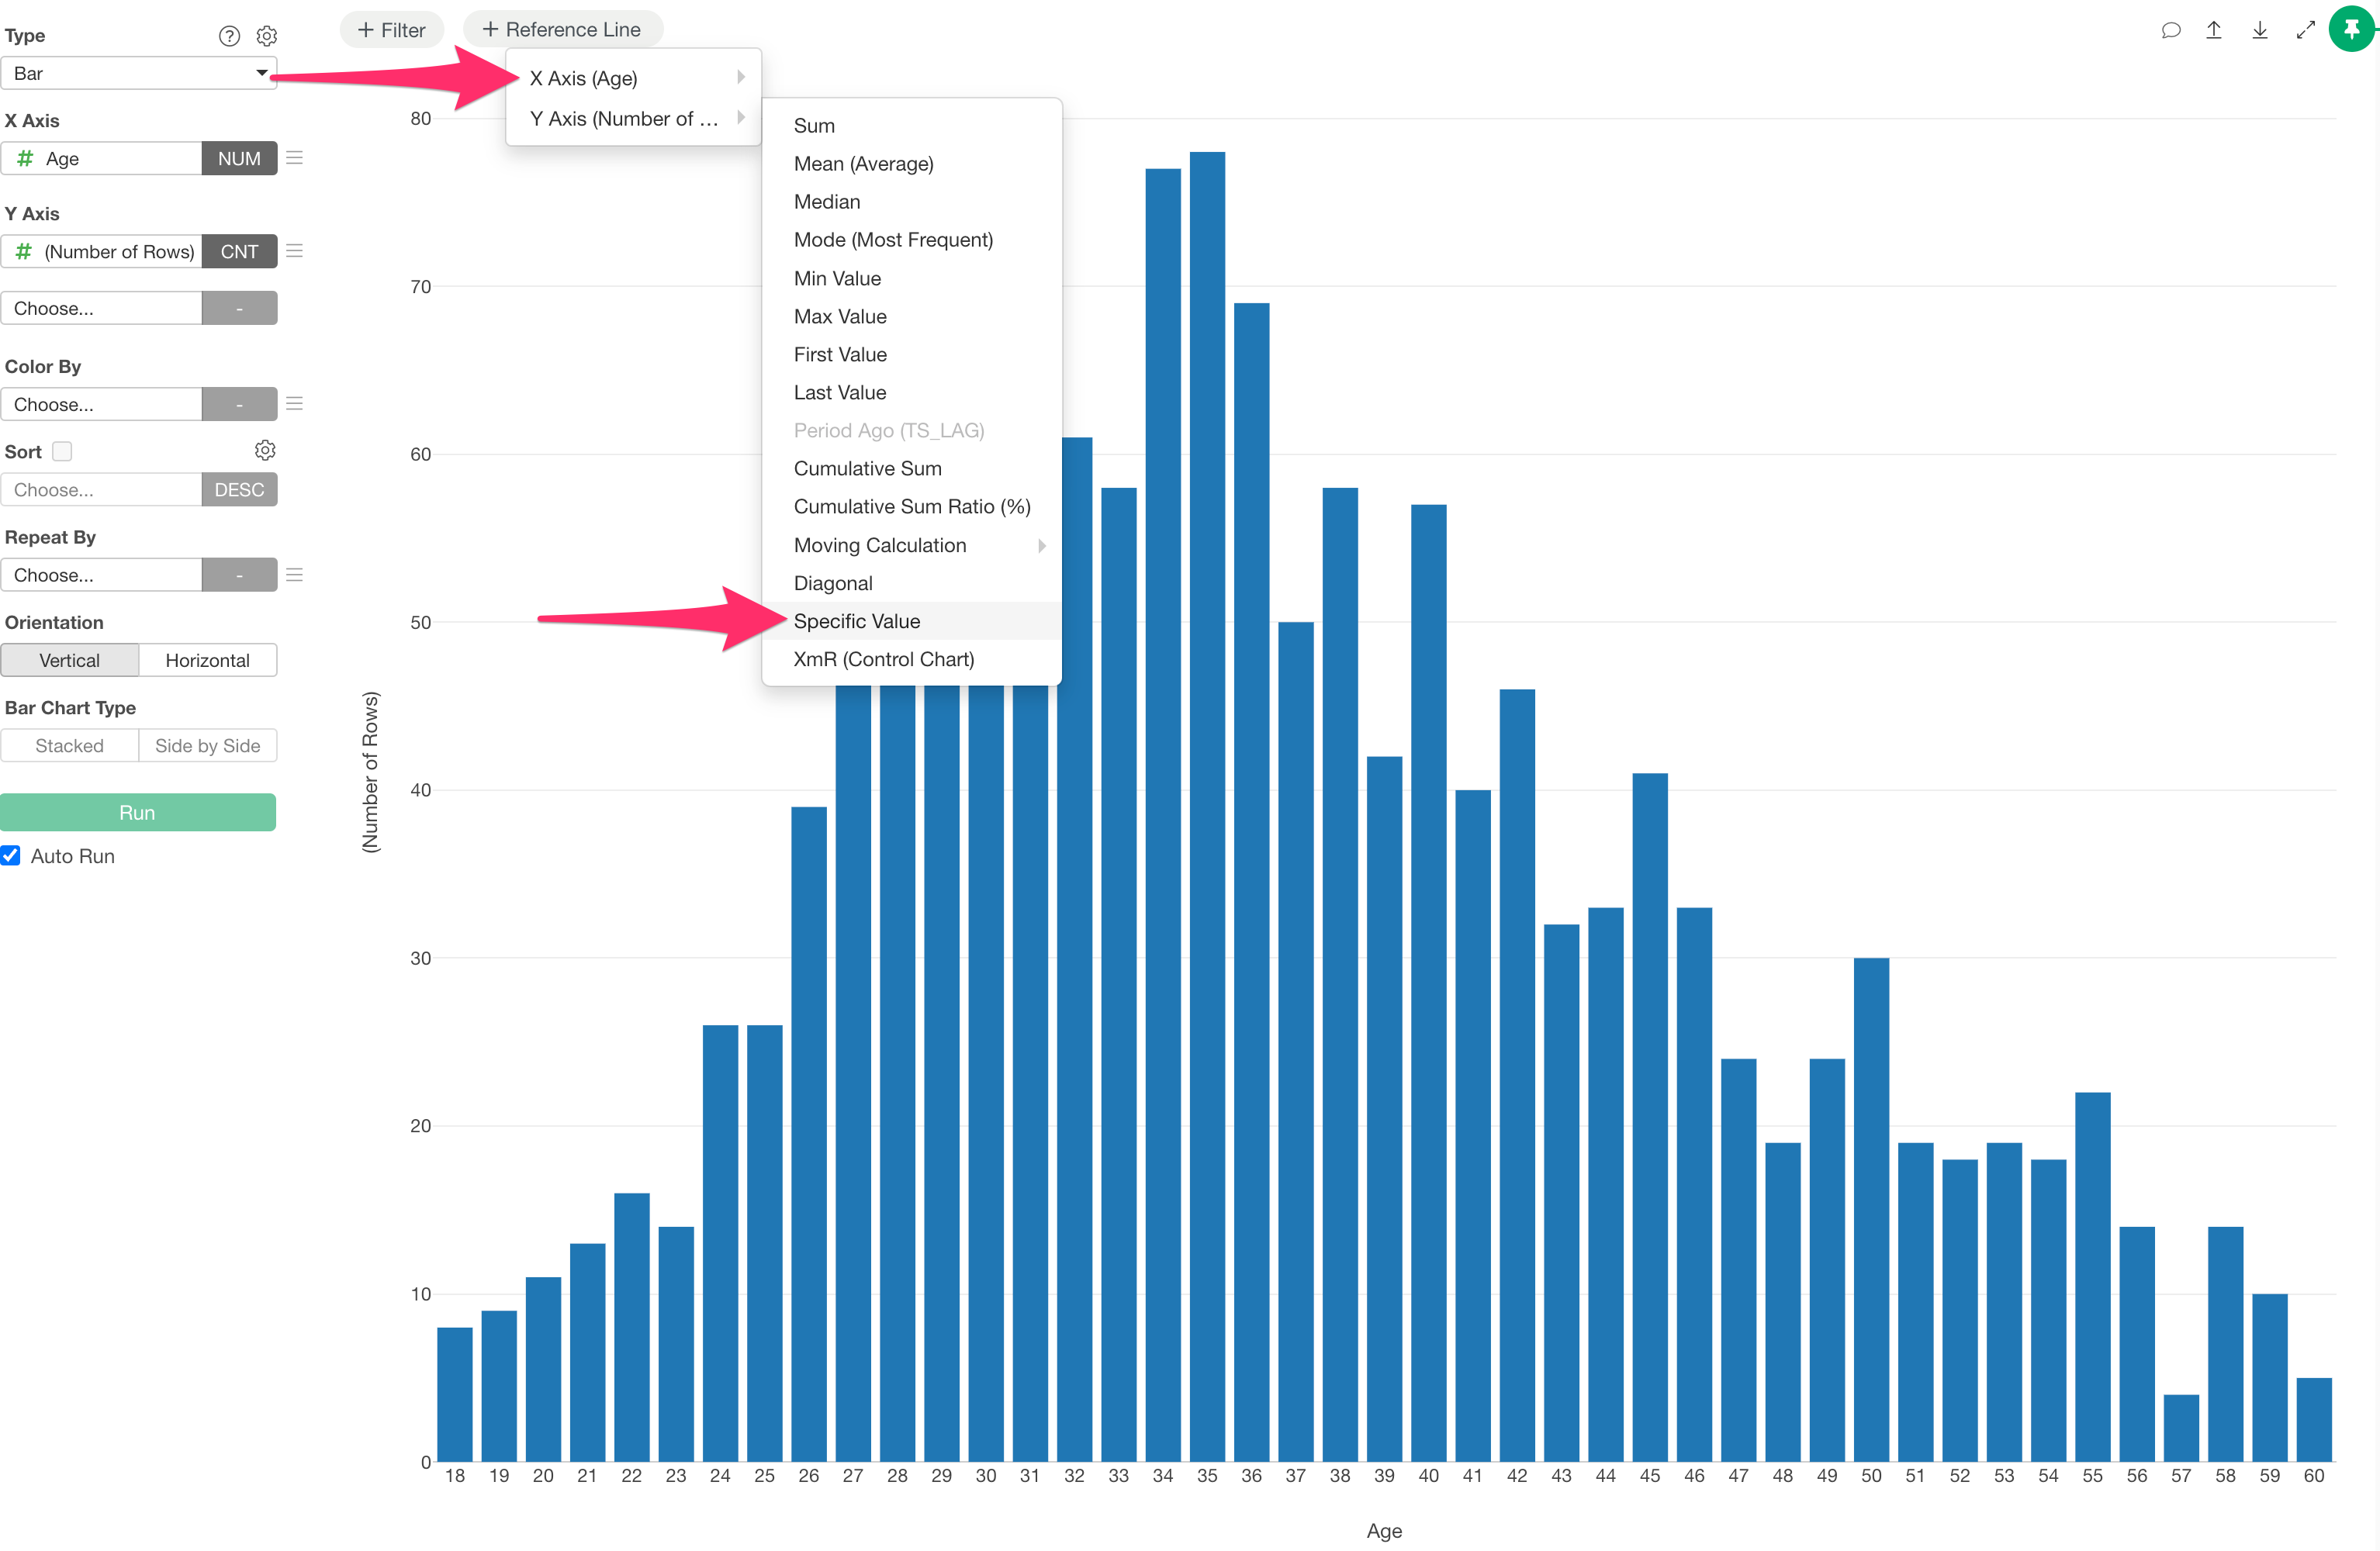
Therefore, if you want to draw a reference line based on the average of the entire column selected for the X-axis, you need to either input a pre-calculated value as Specific Value,
or use a chart type such as a histogram.