For example, suppose you have a line chart showing the trend of a time series metric like the one below.

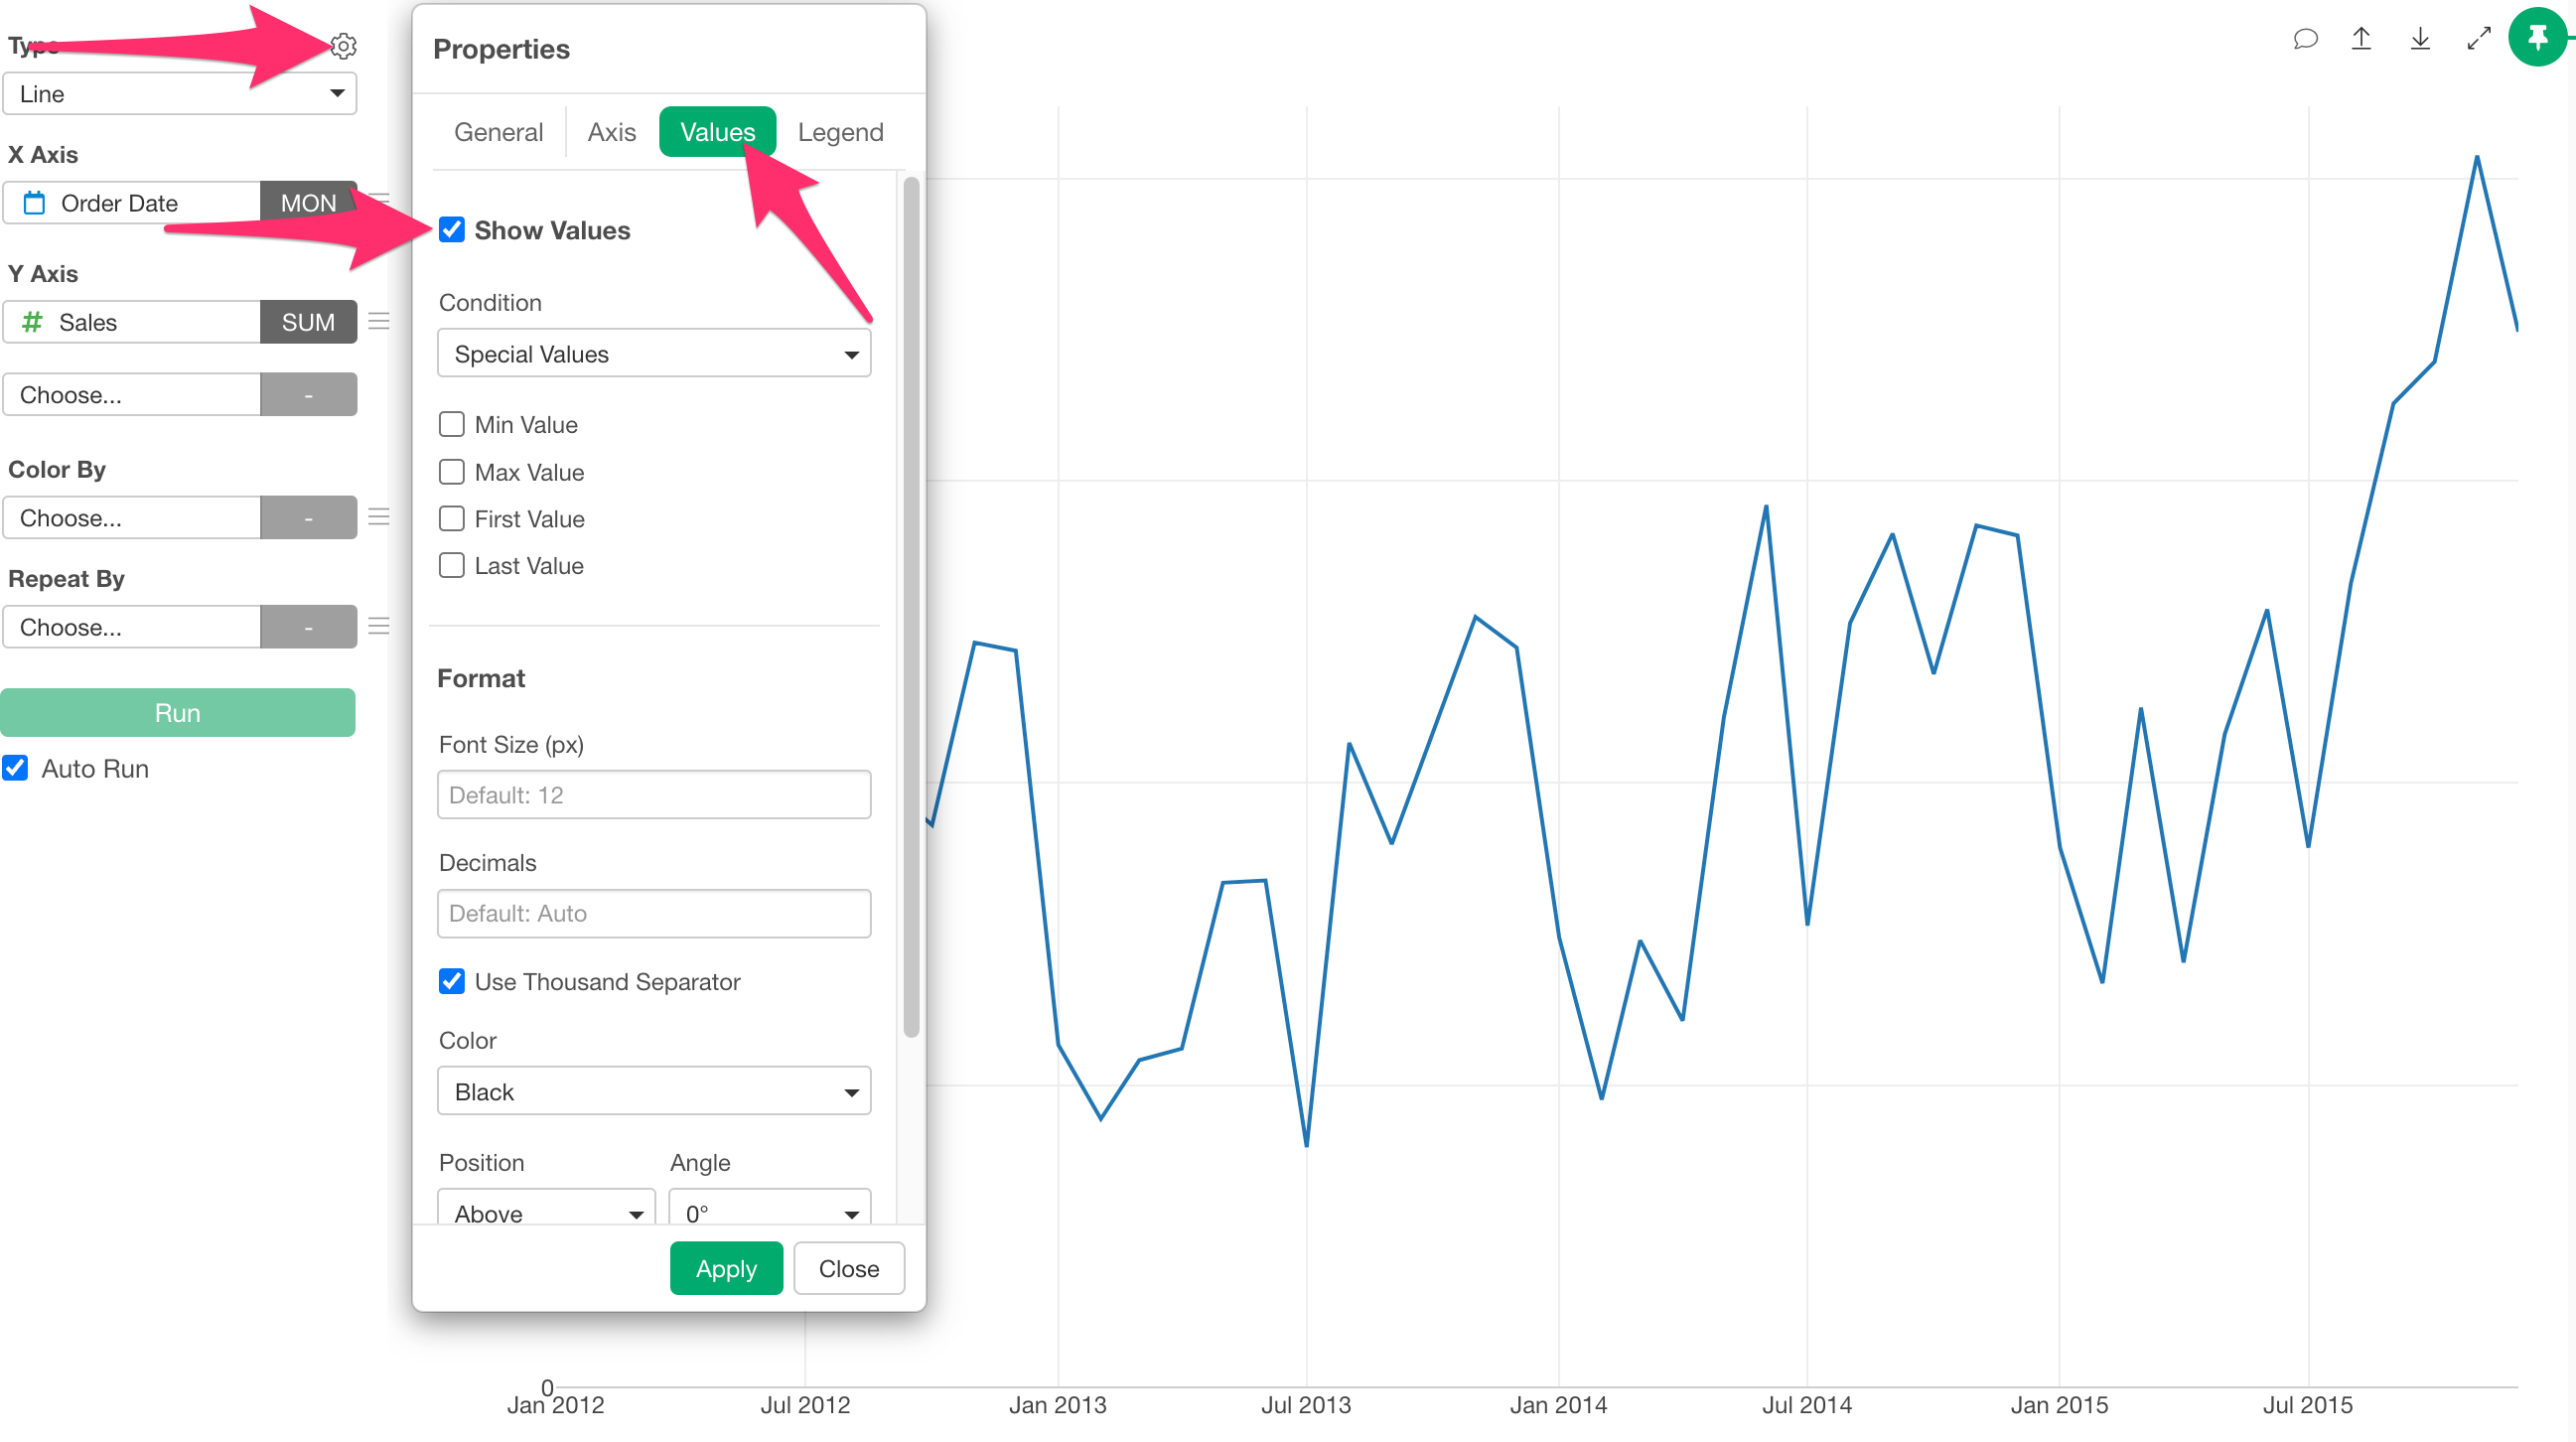
If you want to display the minimum and maximum values on such a chart, click the chart settings icon to open the settings dialog.
Then, select the Value tab and check the option to show values.
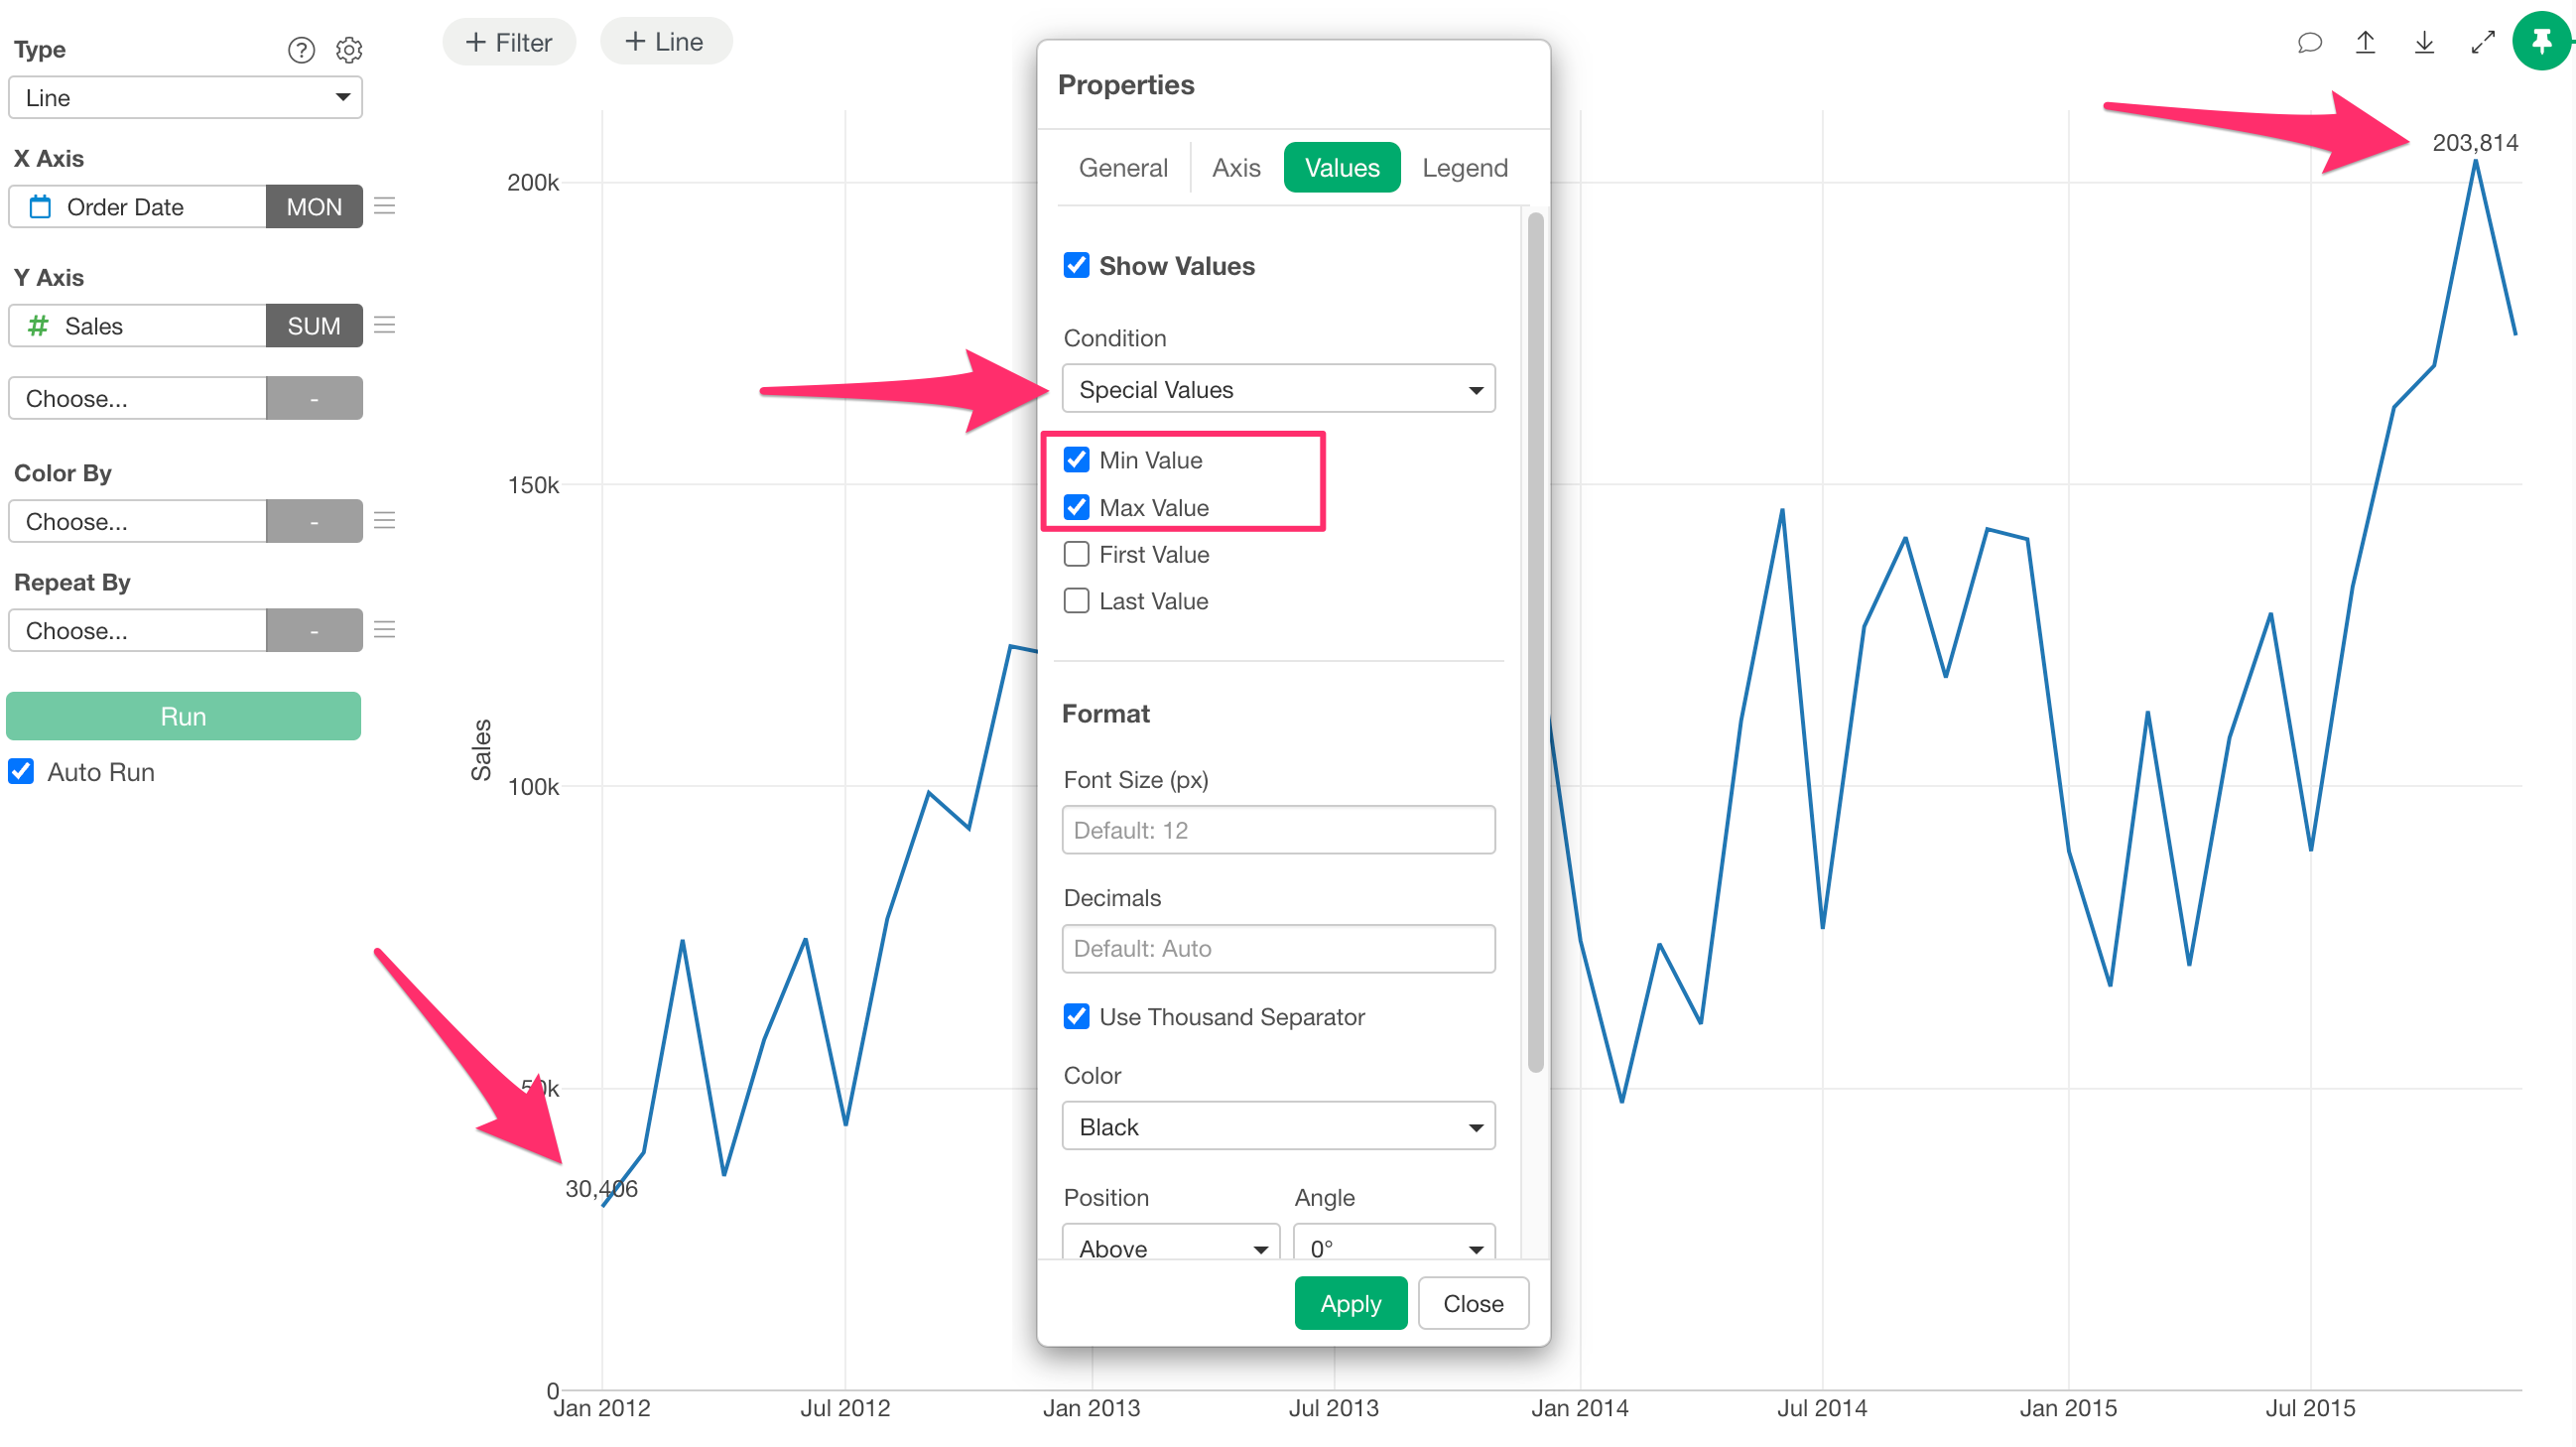
Next, under “Condition,” select “Special Values,” then choose “Min Value” and “Max Value,” and click the Apply button. This will display the minimum and maximum value information on the chart.