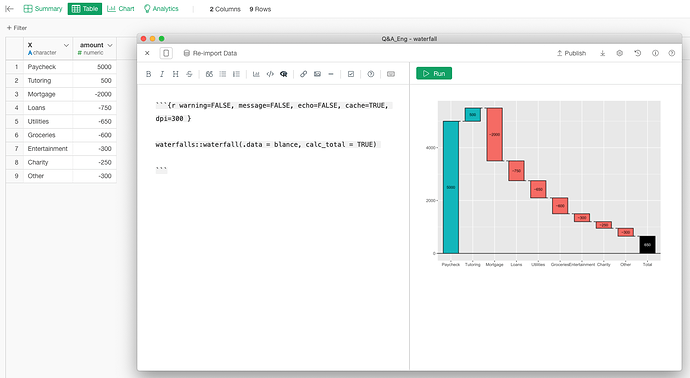
Is it possible to create a waterfall chart using notes? and if so, can you also show how the data frame needs to be structured.
How about using the {waterfalls} package?
This package is not installed by default, so please follow the instructions below to install it.
The data should be constructed as shown in the image. Once you have the data, you can use this package to visualize the waterfall chart on your notebook.
Ref : waterfalls package
Thank you for this. How do I create this data frame from let’s say from a sales database?

