When you select “TRUE Ratio” for the Y-axis in a chart, it is calculated as the ratio of TRUE values to all rows, including NA (missing values).
For example, in the following case, there are 10 rows with 5 TRUE values and 2 NA (missing) values.
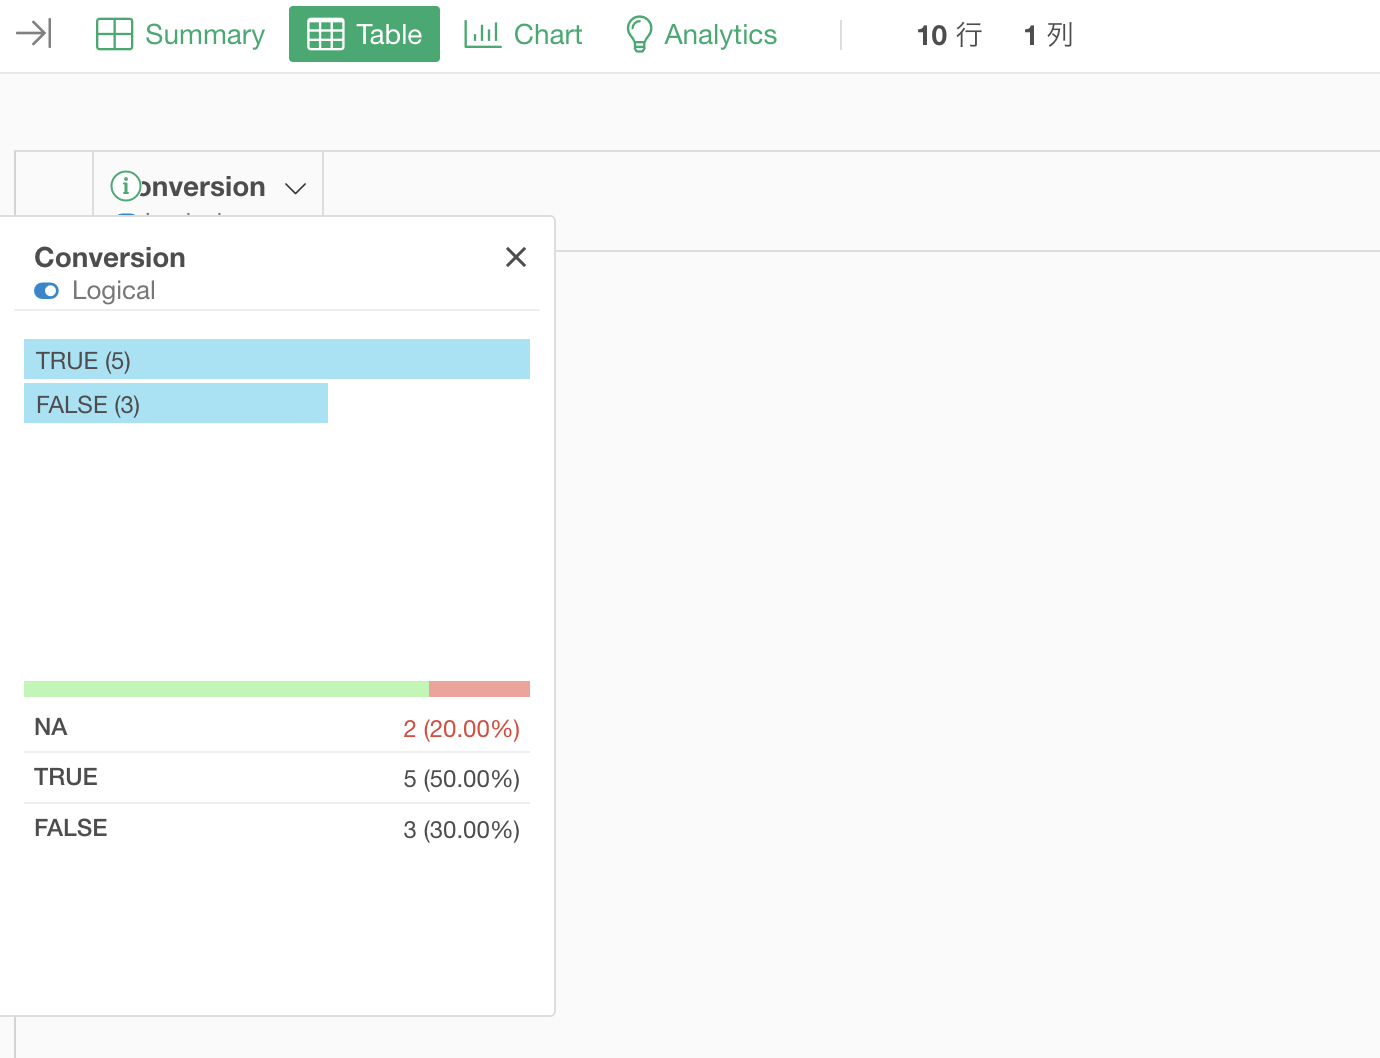
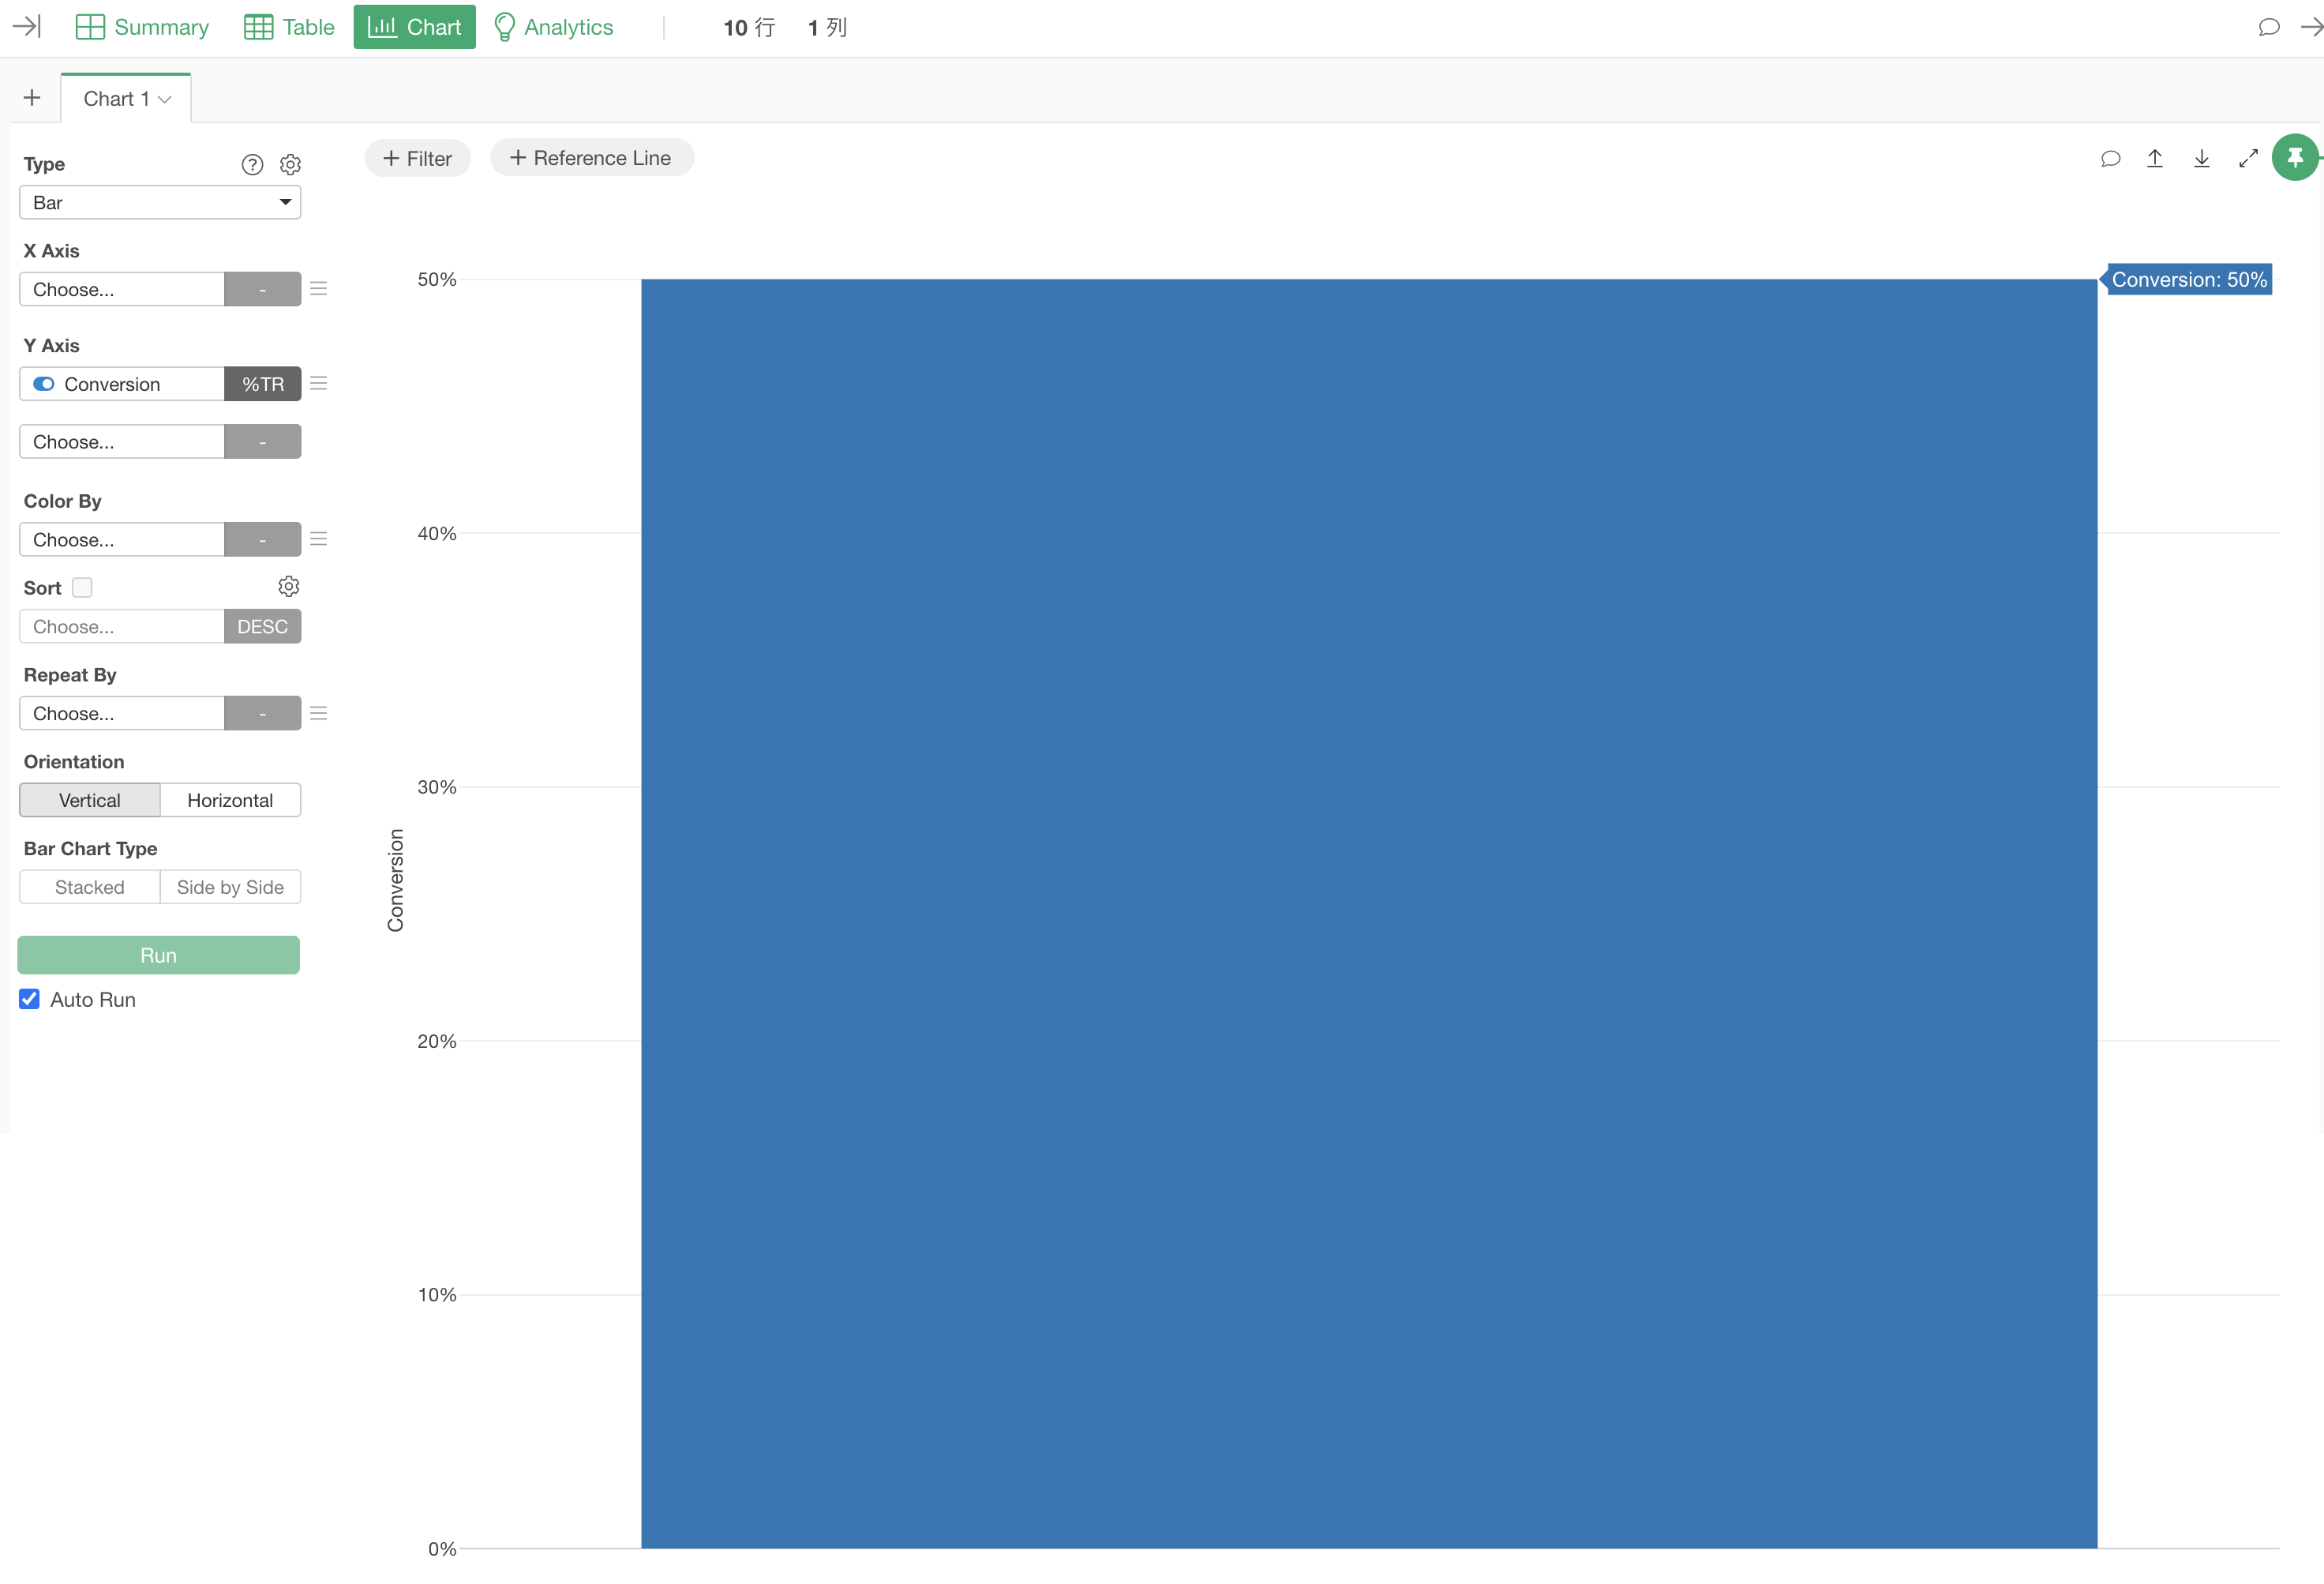
In this case, setting the Y-axis to “TRUE Ratio” results in 50% (5/10). This means the ratio is calculated against all rows without excluding NAs.
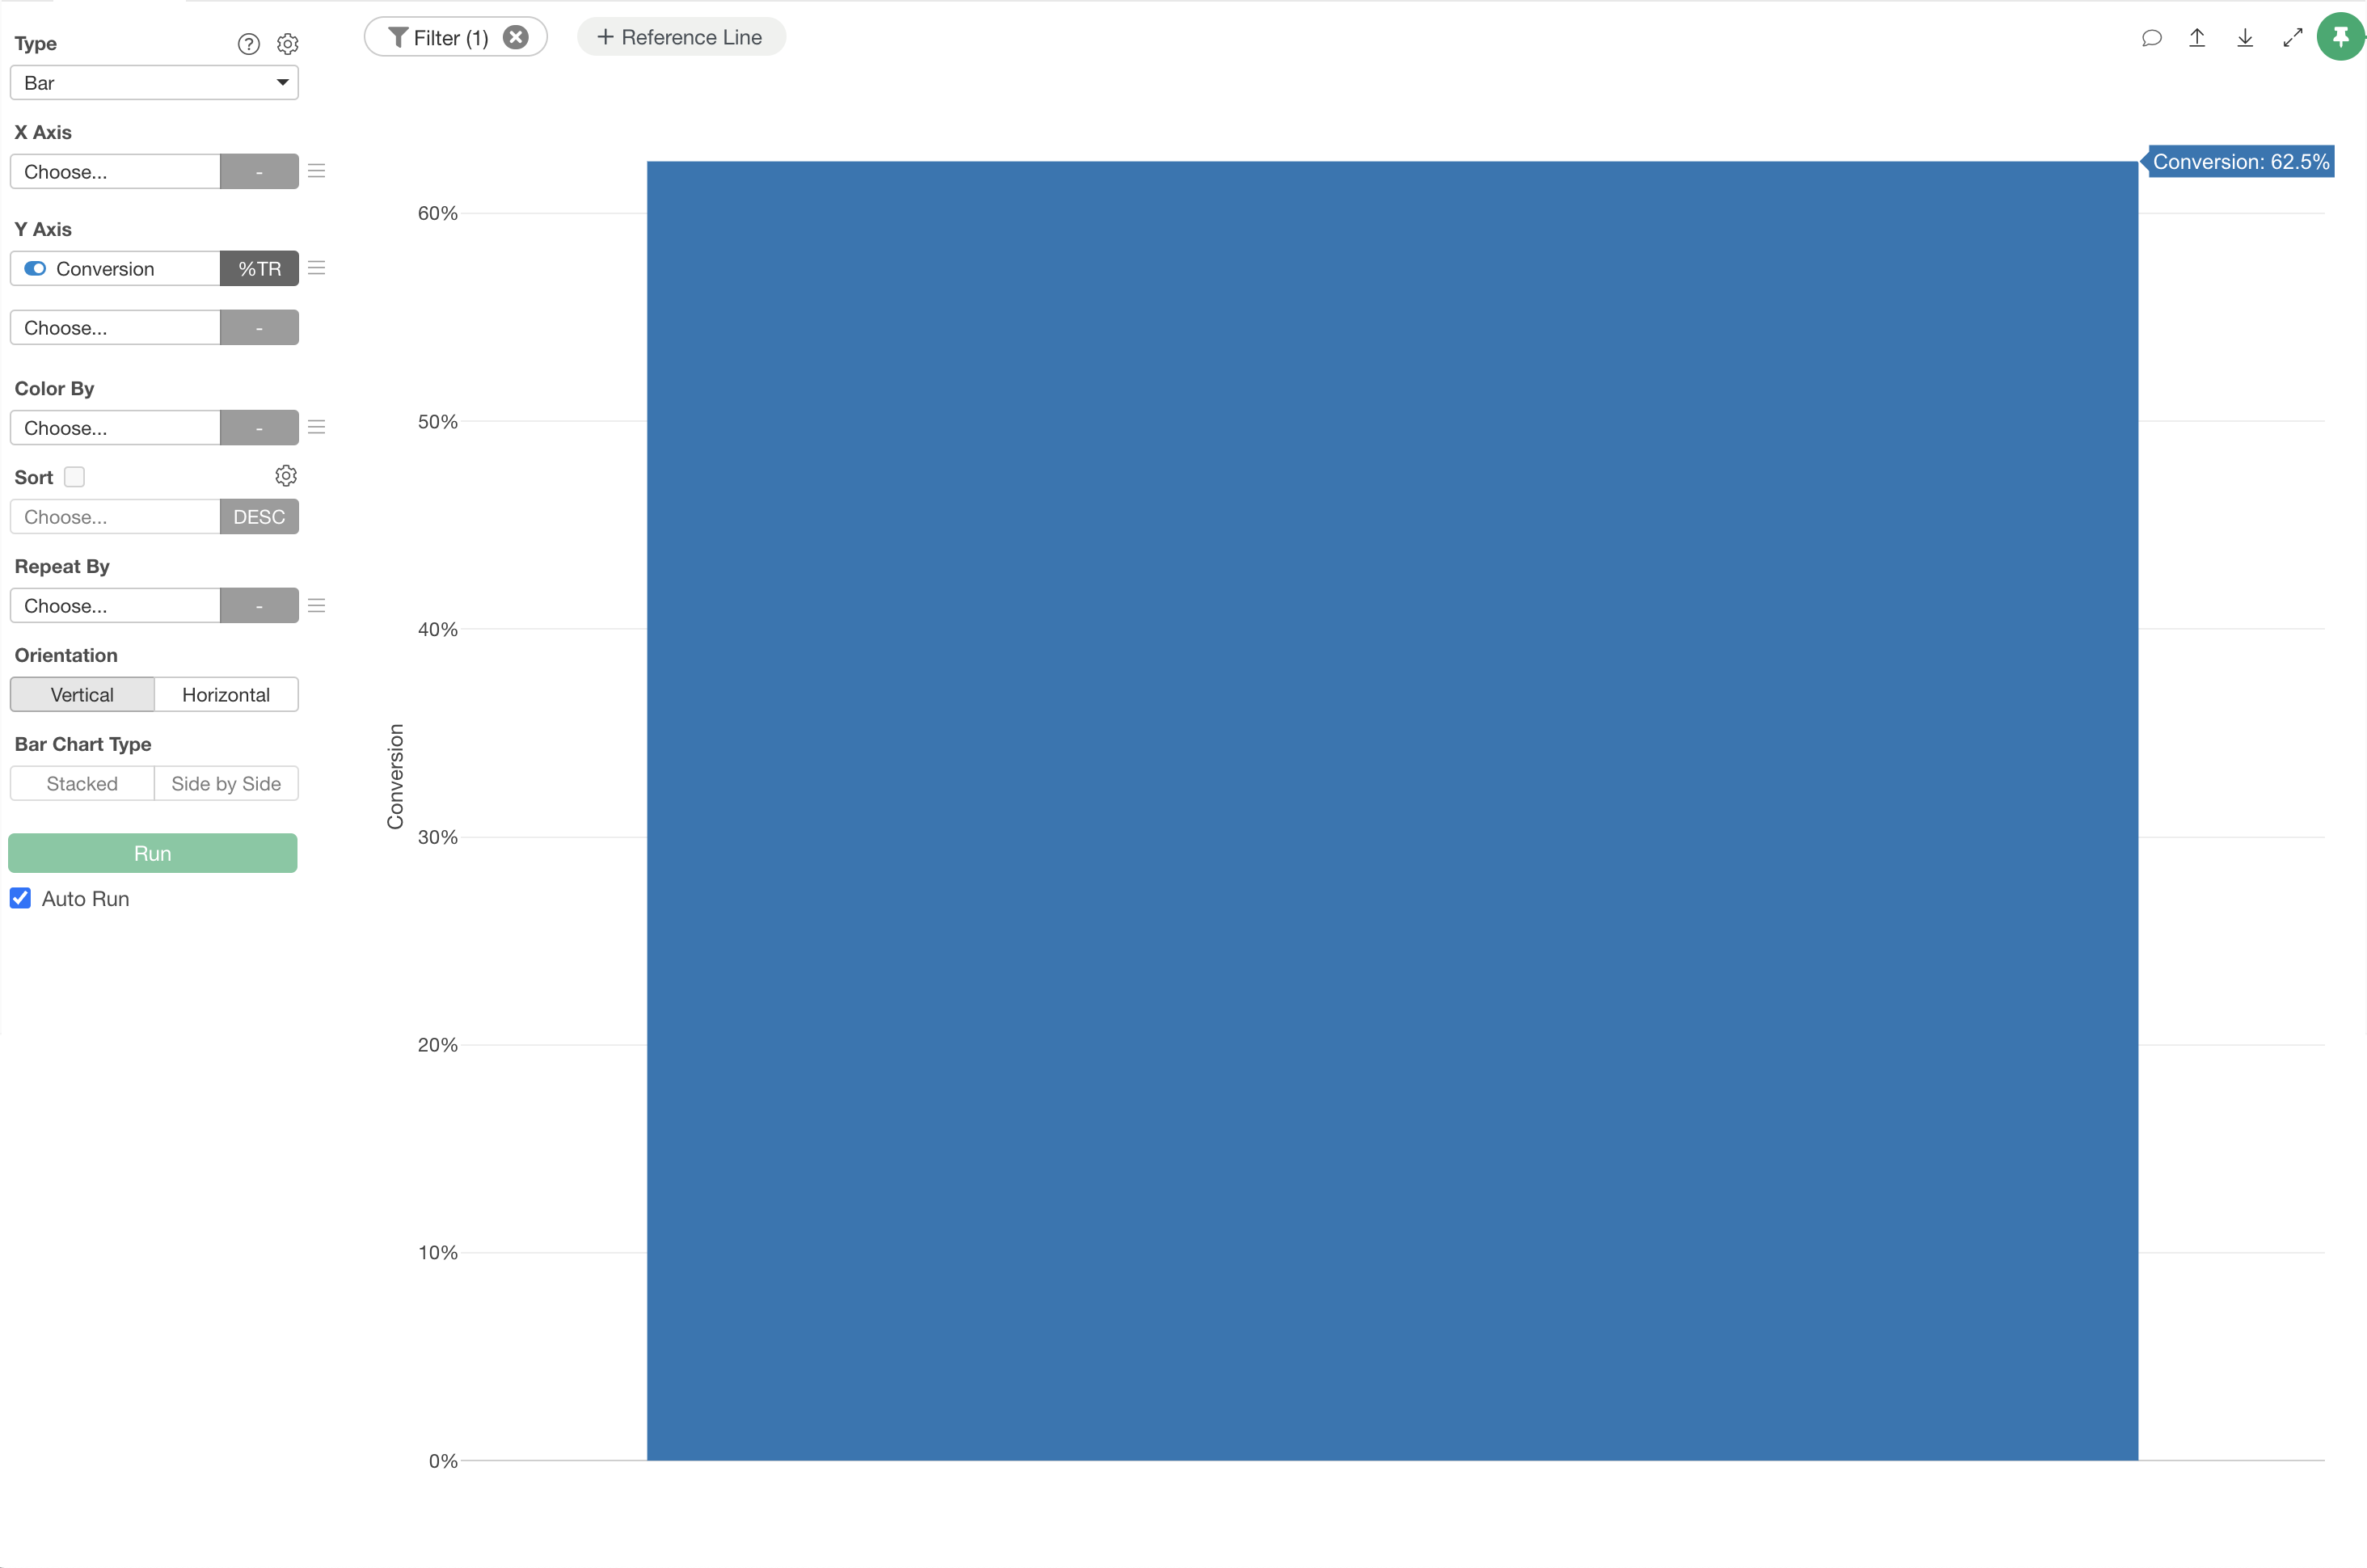
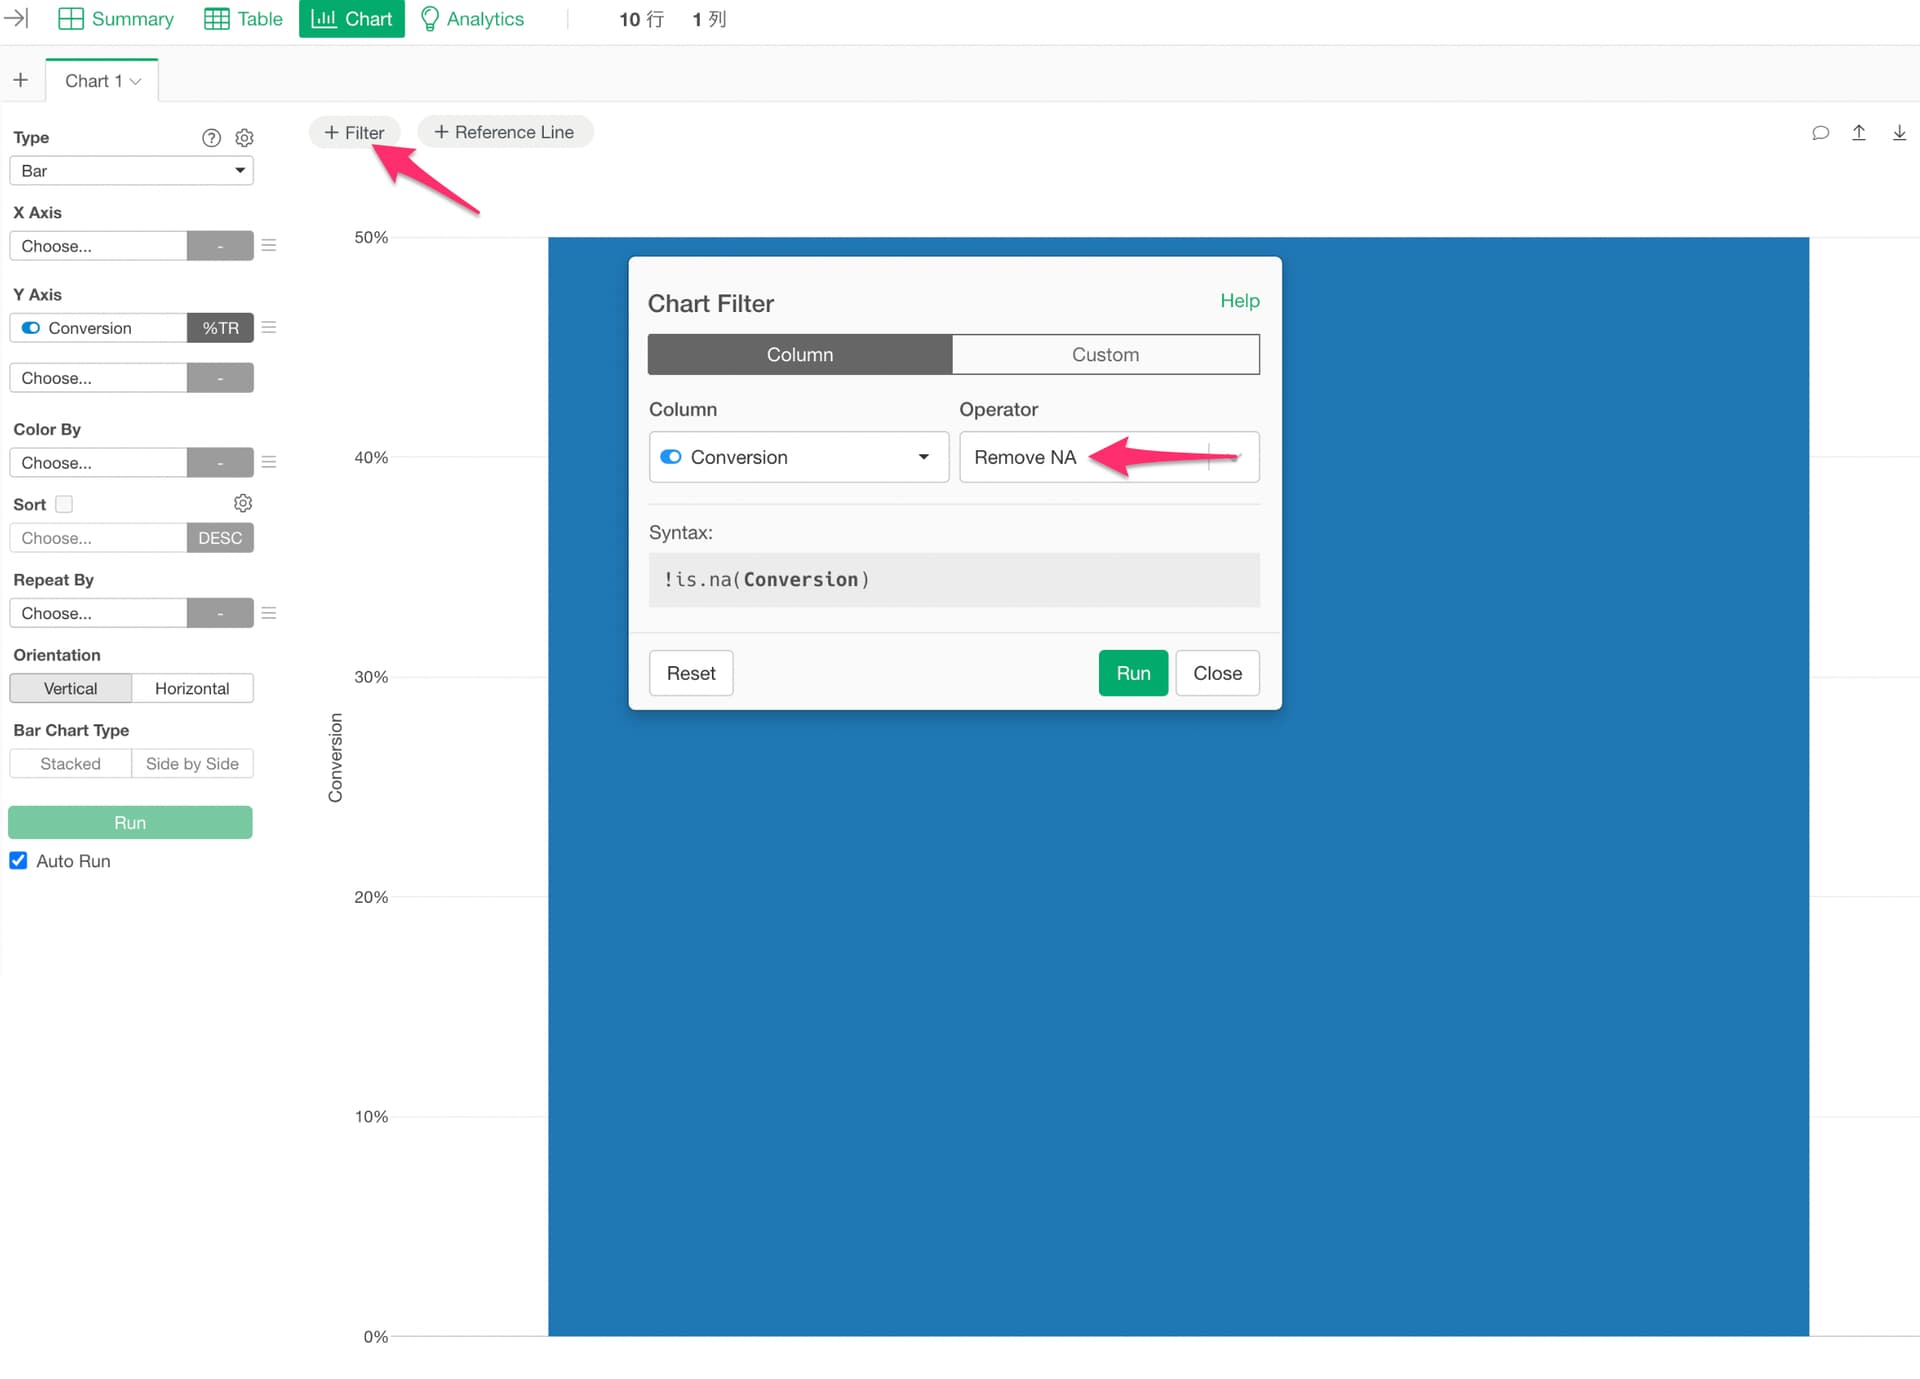
If you want to calculate the TRUE ratio excluding NAs, set a chart filter on the logical column to remove missing values.
This changes the TRUE ratio to 62.5% (5/8) in the example above.