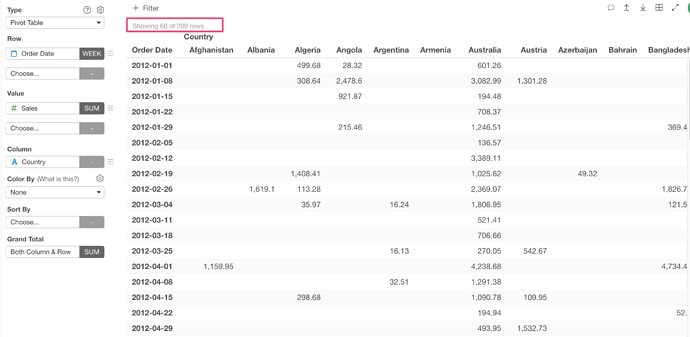
If you use Pivot Table with columns including many unique values for both Rows and Columns, you may see the message on the top like “Showing 60 of 209 rows”.
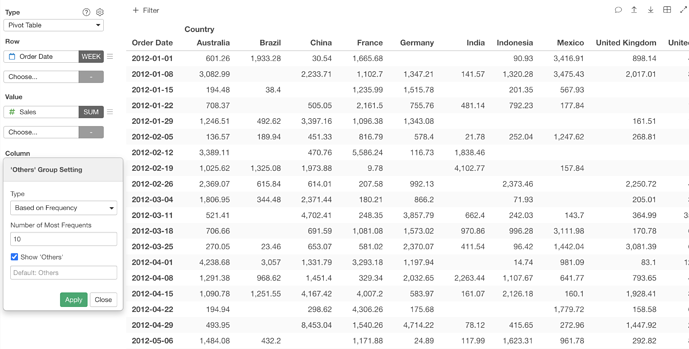
In Pivot Table, there is a limit on the total number of cells which is basically (# of columns) x (# of rows) for the UI performance reason. So you can reduce the number of columns to show more rows. There are a couple of ways to do it. You can adjust the “Others Group Setting” at the column like the following. You can also use a chart filter to limit the number of columns too.


