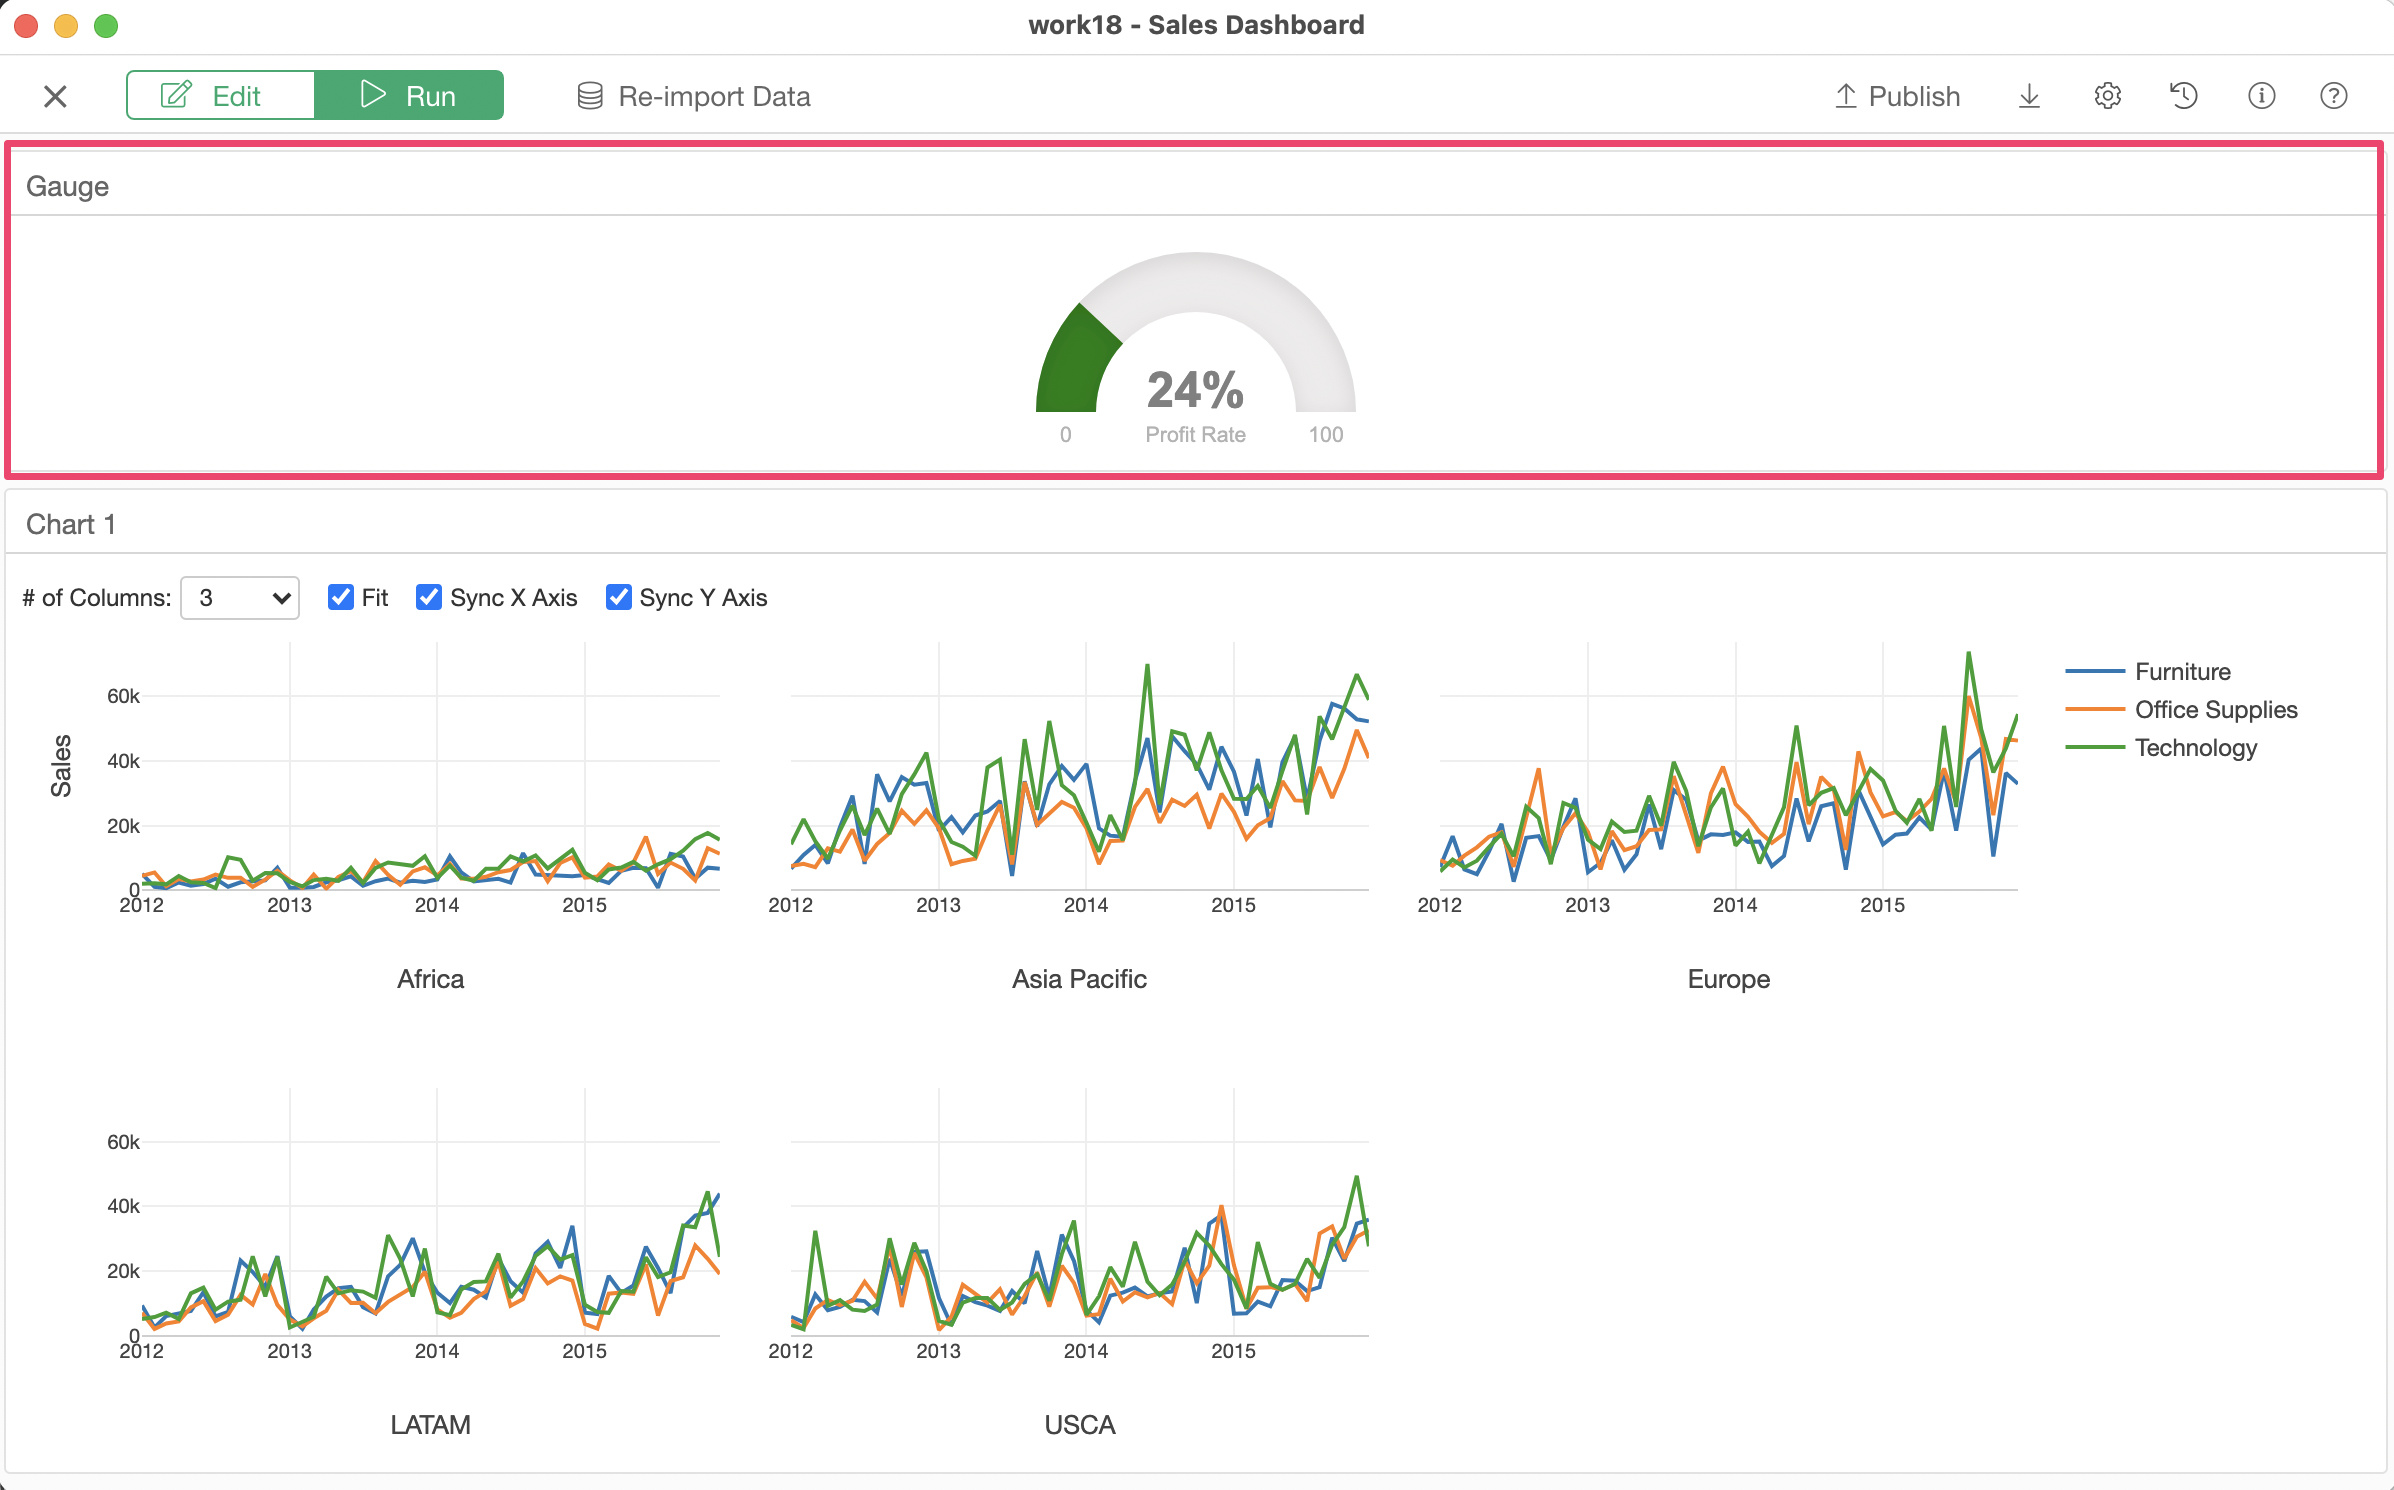
If you have an R code that can generate a chart, you can embed the chart in your Dashboard. Here is how.
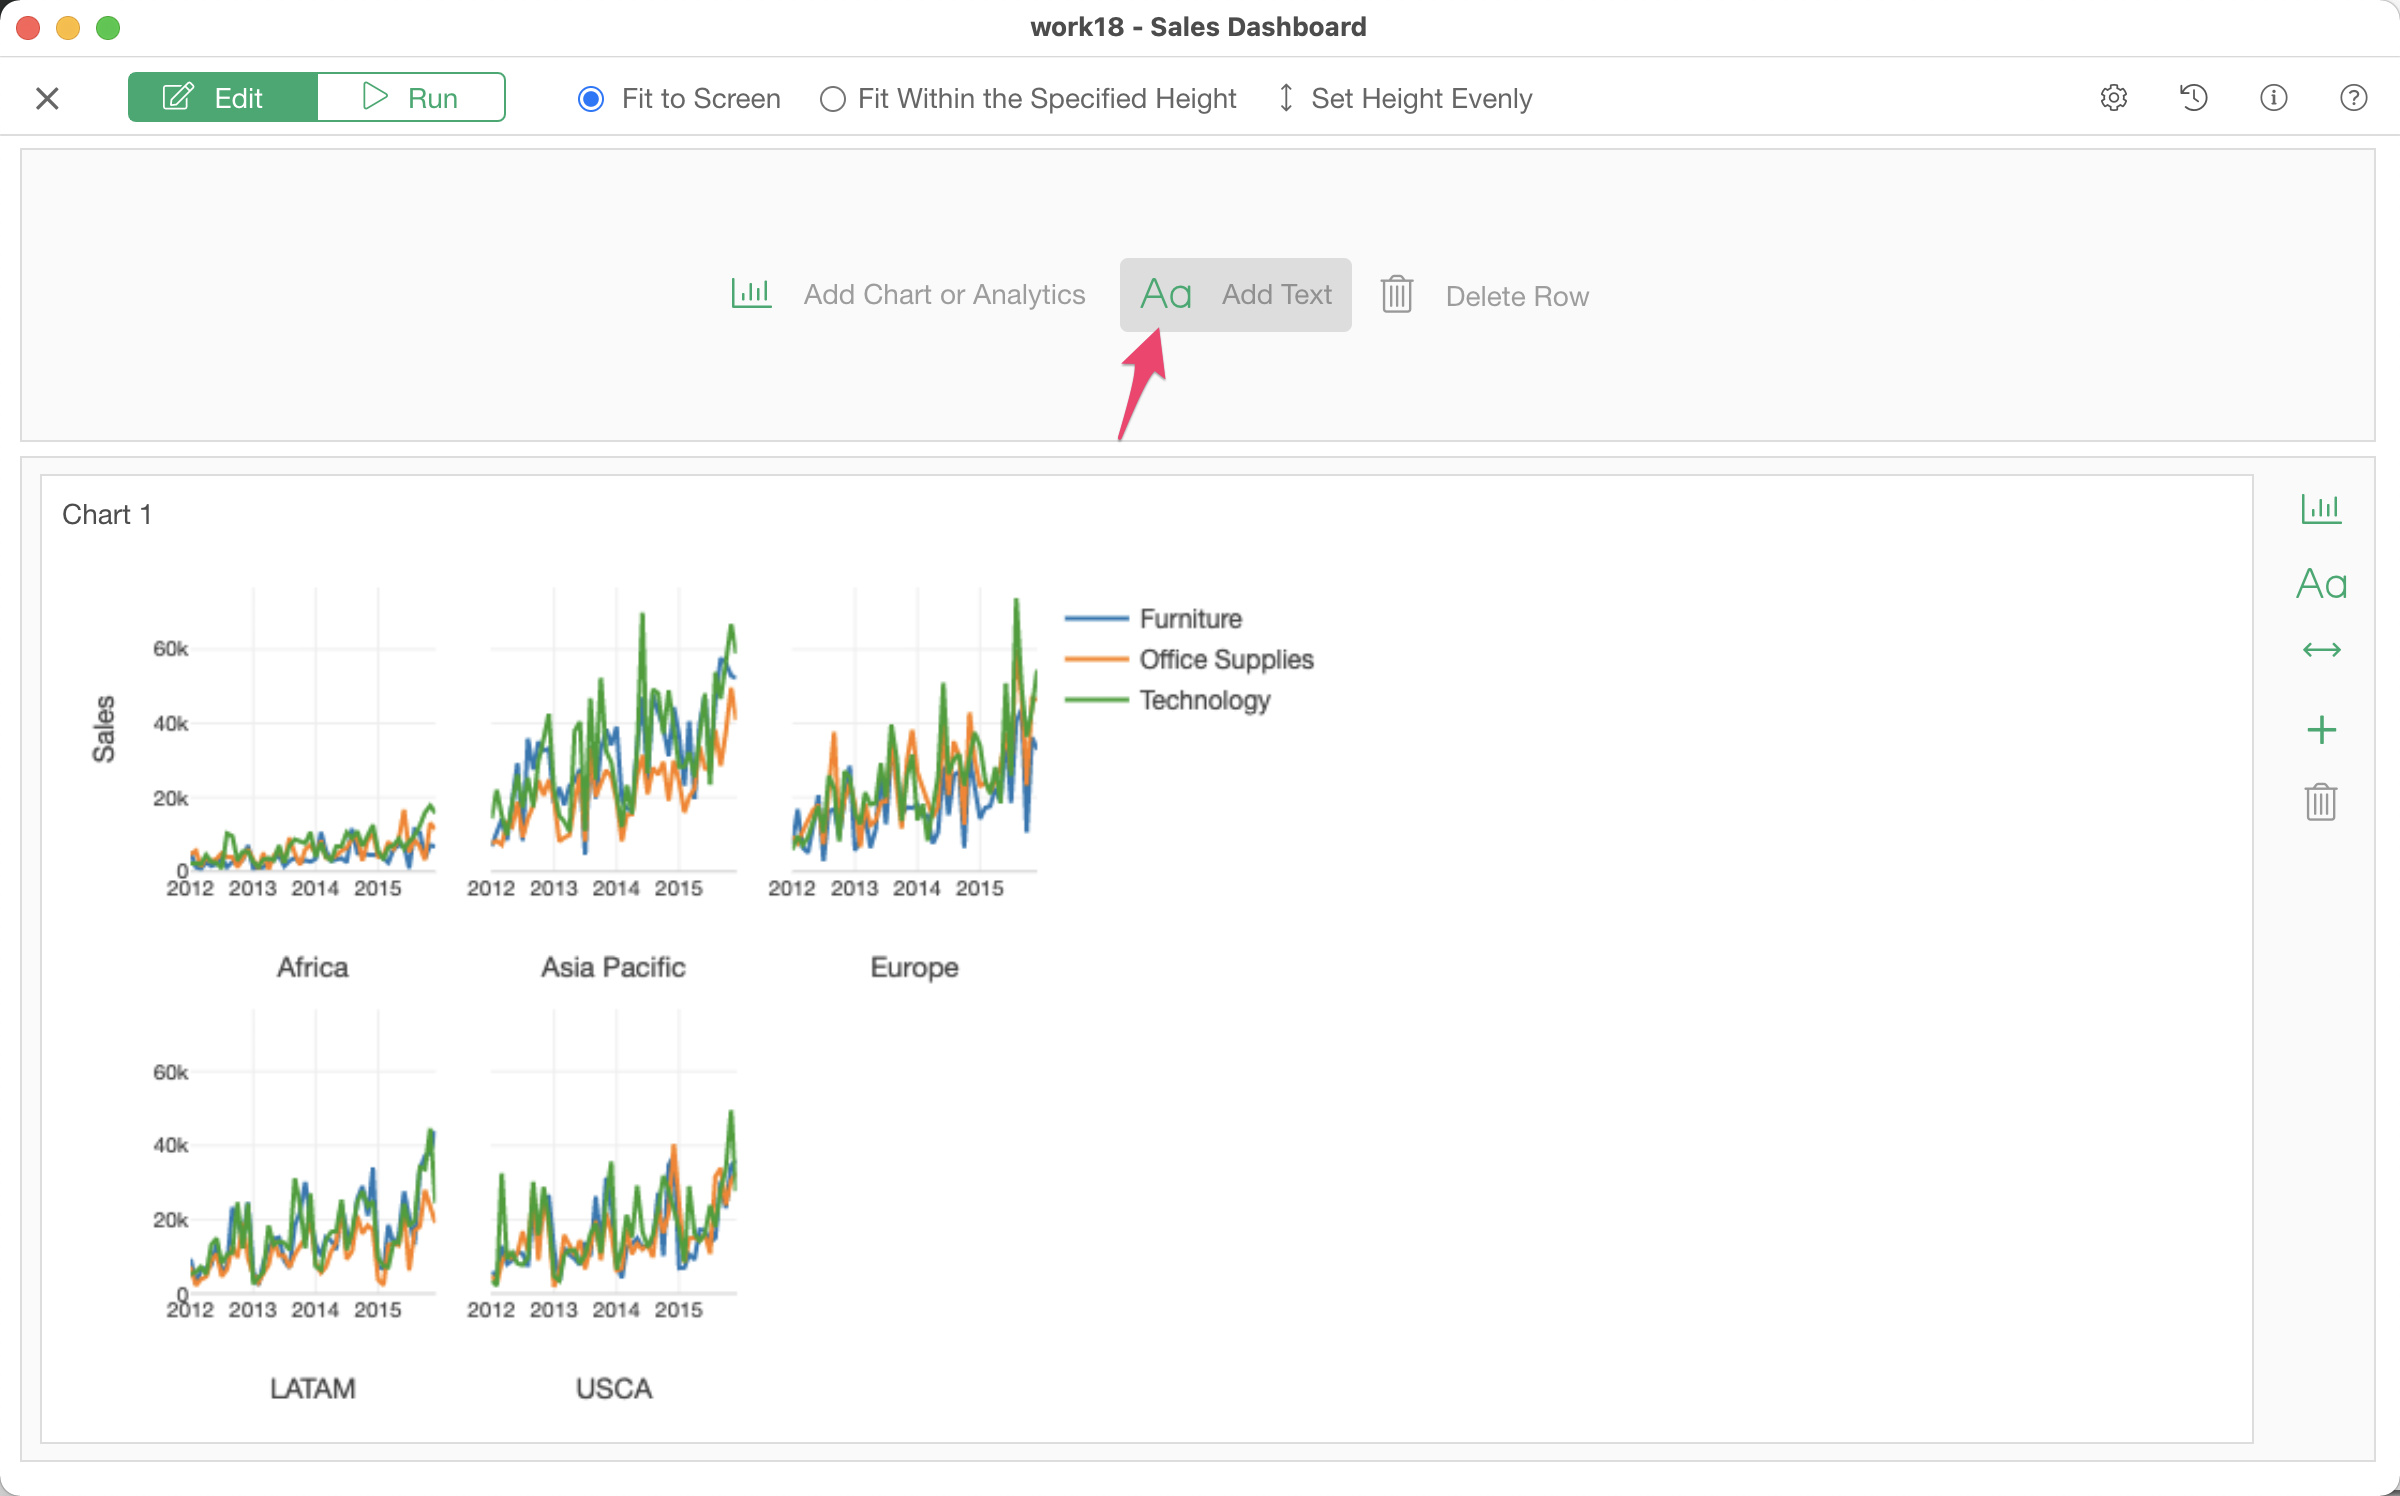
- Click “Add Text” where you want to embed your chart.
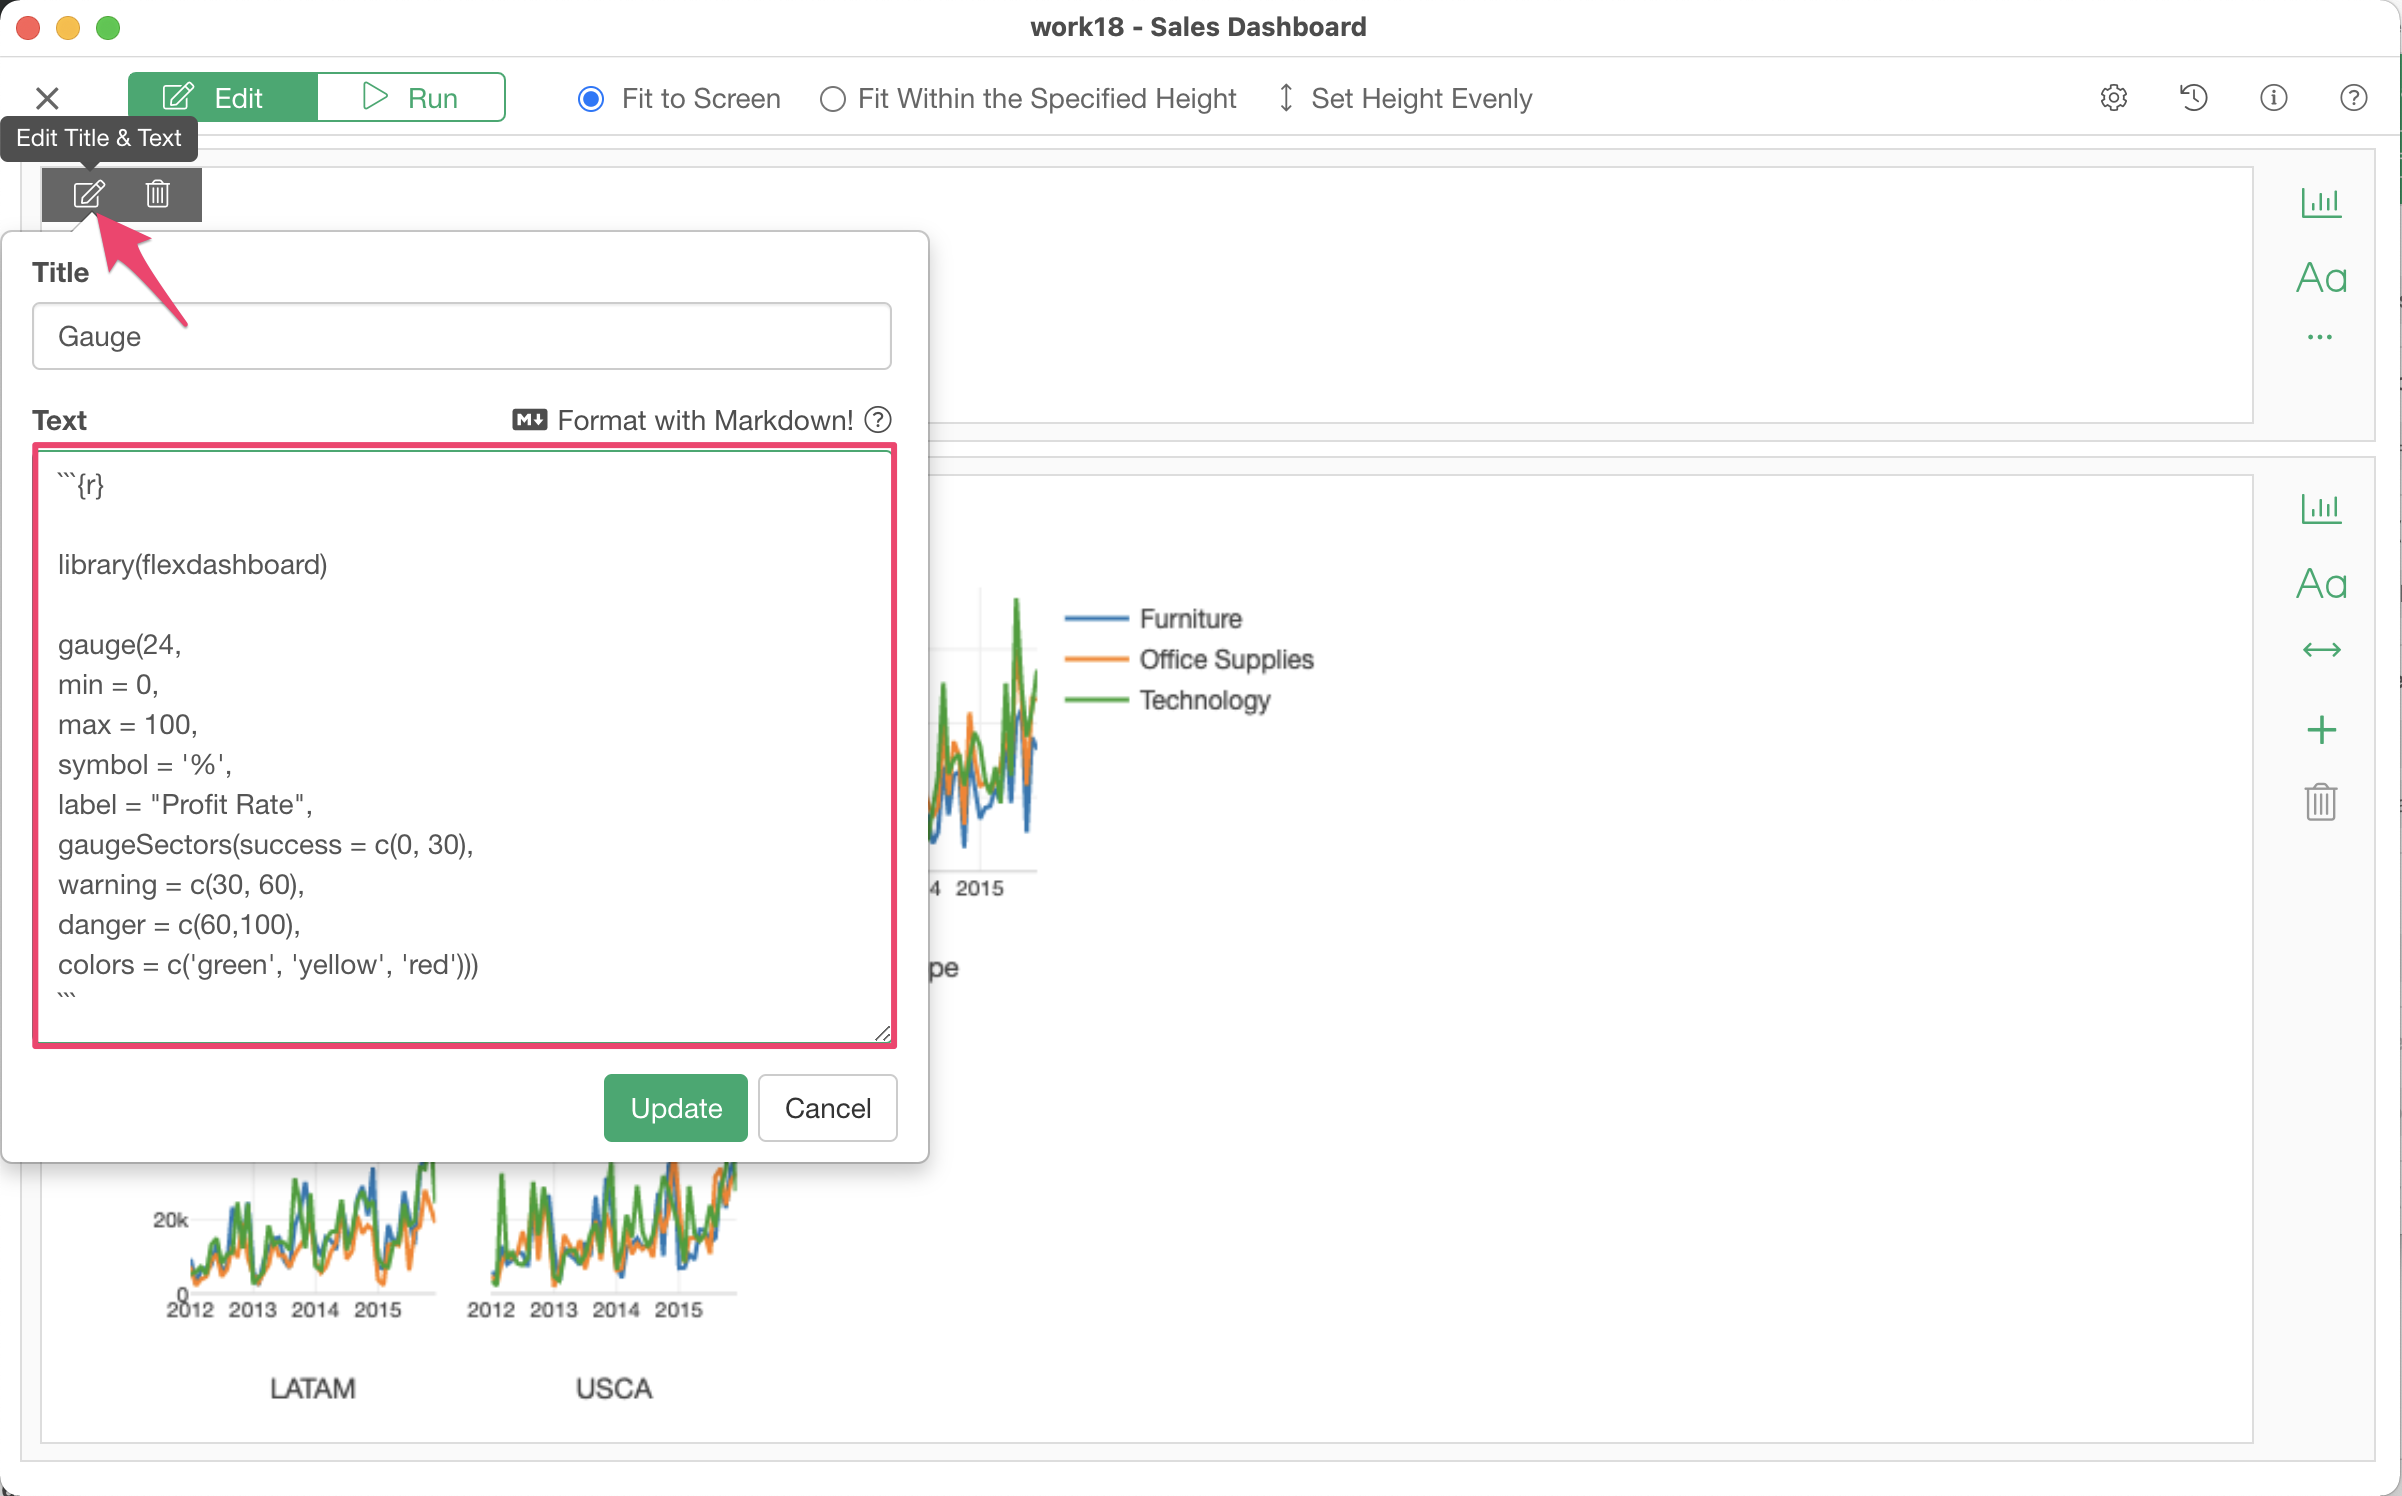
- Open the “Edit Title & Text” dialog and insert the R code surrounded by the R code chunk syntax into the “Text” input field. Here is a code example.
```{r}
library(flexdashboard)
gauge(24,
min = 0,
max = 100,
symbol = '%',
label = "Profit Rate",
gaugeSectors(success = c(0, 30),
warning = c(30, 60),
danger = c(60,100),
colors = c('green', 'yellow', 'red')))
```
- Run it, then you will see the chart in your Dashboard.