There are a few ways to do this.
Summarize correlation values between the variables.
- first you want to use ‘group_by’ to group the data, if necessary
- then use ‘summarize’ and type ‘cor()’ under ‘Custom’ tab.
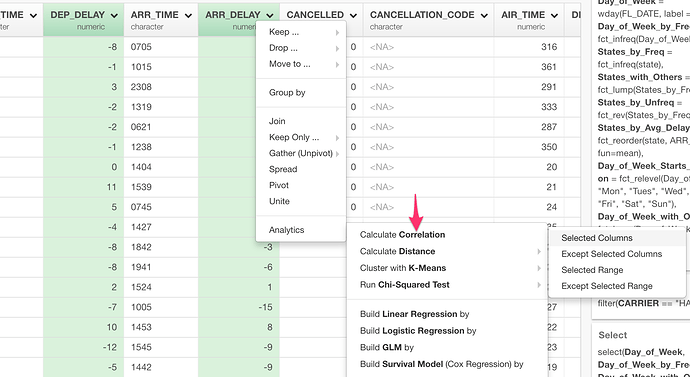
Run Correlation (cor) for all the pairs of the variables.
You can select ‘Calculate Correlation’ from the column header menu.
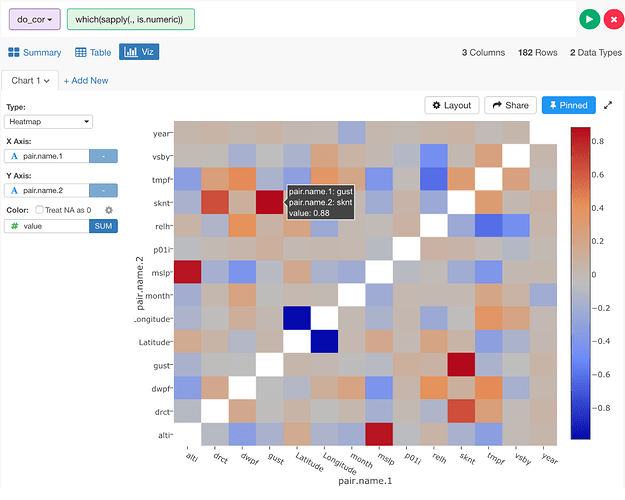
Then, you can visualize the result like this in Viz.
Here’s how-to blog post for running Correlation in Exploratory. It’s based on an older version, but you get the basic idea of how it works in Exploratory.
Build Linear Regression or GLM model
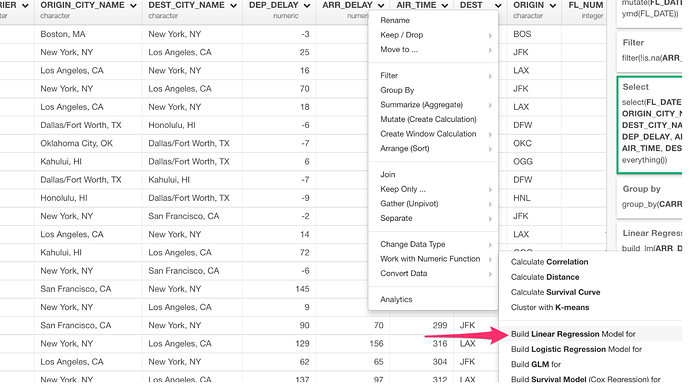
Lastly, you can quickly build Linear Regression or GLM.
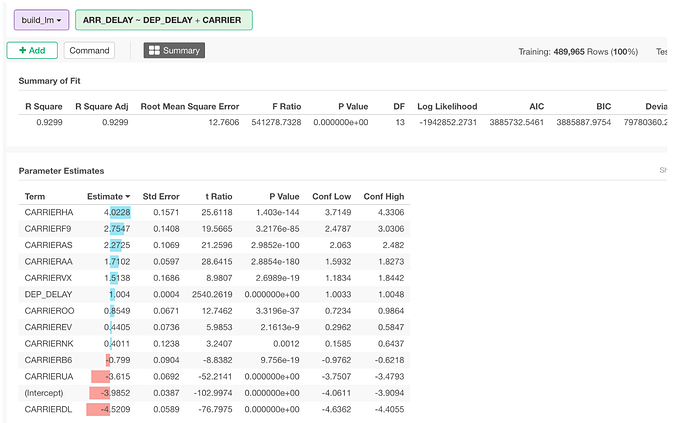
This will give you the stats including R Squared, RMSE, etc.
Here’s more details.


