Thanks for such an amazing tool! First-time post here. I am having a hard time with a simple concept…
My data is set up with a column of observations of two factors: Cesarean section and vaginal delivery. I would like to create a bar chart with the PROPORTION of each type of procedure per year instead of the NUMBER of each type of procedure per year.
Thank you in advance.
Tyler
@Tyler_Muffly.
Nice to meet you
Depending on the structure of the data, the procedure is different.
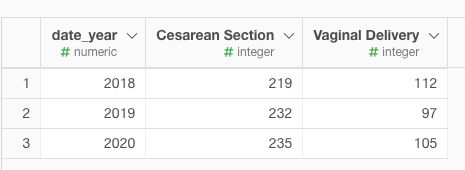
- The first pattern is when the two factors are stored in two columns, as shown in the image.
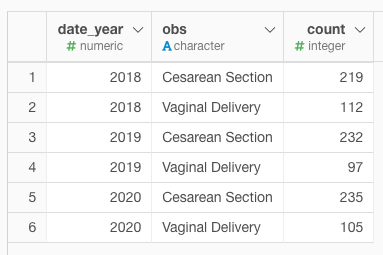
- The second pattern is when the two factors are stored in one column, as shown in the image.
I think this is probably the first pattern, so I’ll show you how to do it.
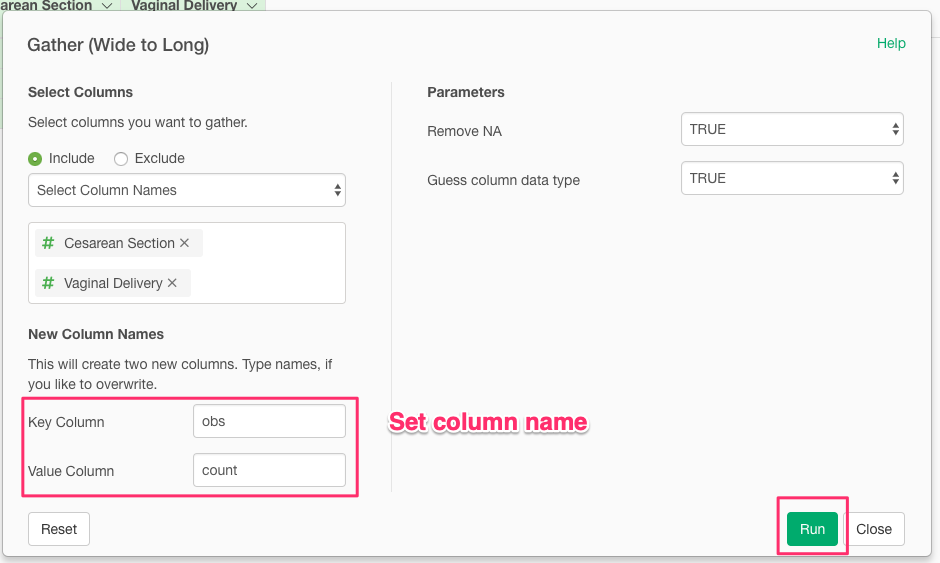
In such a data structure, the data needs to be pre-processed before it can be moved to the chart window to convert the data structure from Wide to Long. Set it as shown in the following image.
Go to the chart window and set the Window Calculation from the Y-axis menu. Set it as shown in the following image.
I’m sorry that my English is not good.
I hope you find it helpful.
1 Like
This was incredibly helpful. Thank you very much!
1 Like