In Exploratory, it is generally not possible to change the date unit after creating a chart or dashboard.
However, by utilizing the parameter function, it becomes possible to dynamically switch the date unit of charts (day, week, month, year).
This allows you to perform analysis with different time scales such as daily, weekly, and monthly on the same chart, switching between them in real-time on the dashboard.
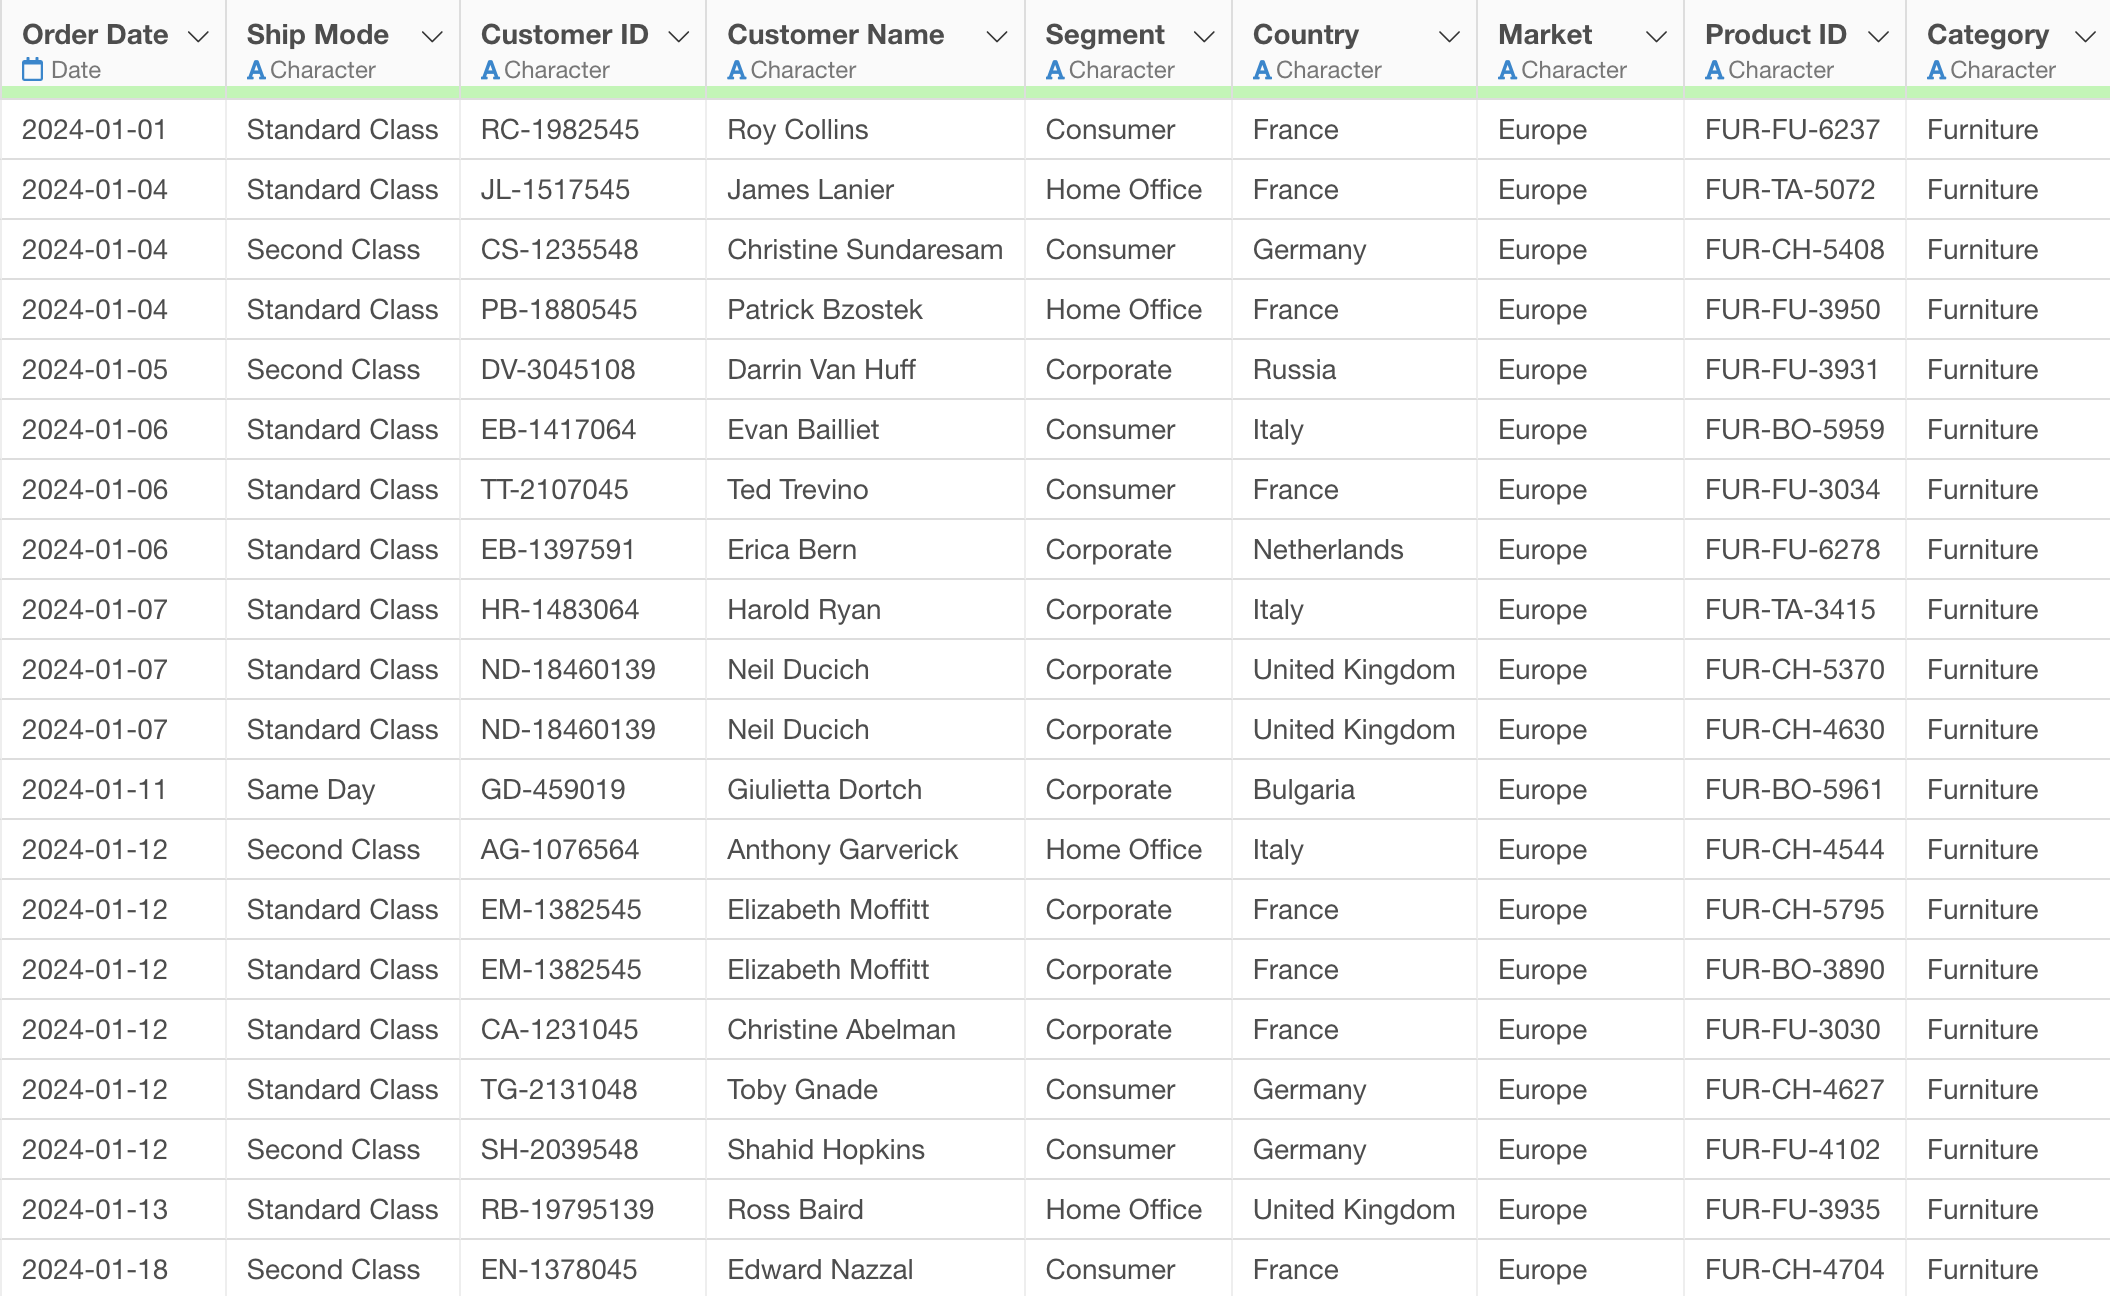
The data used in this example is order data, where each row represents one order. Each row contains information such as customer details, order date, products, and sales.
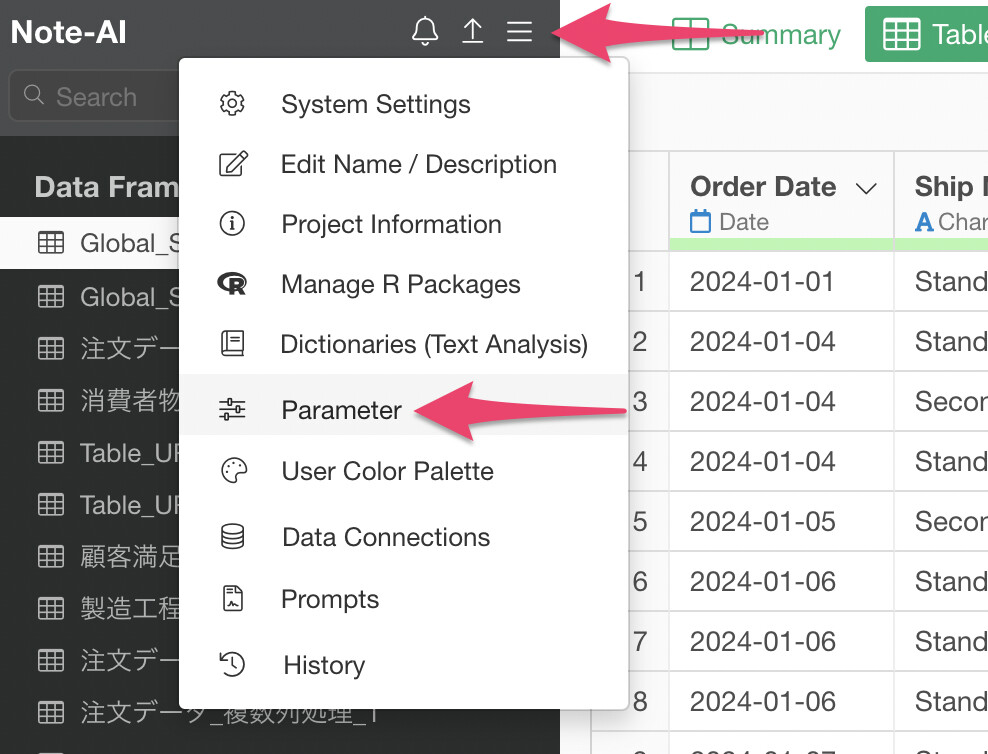
Select “Parameters” from the project menu and create a new parameter.
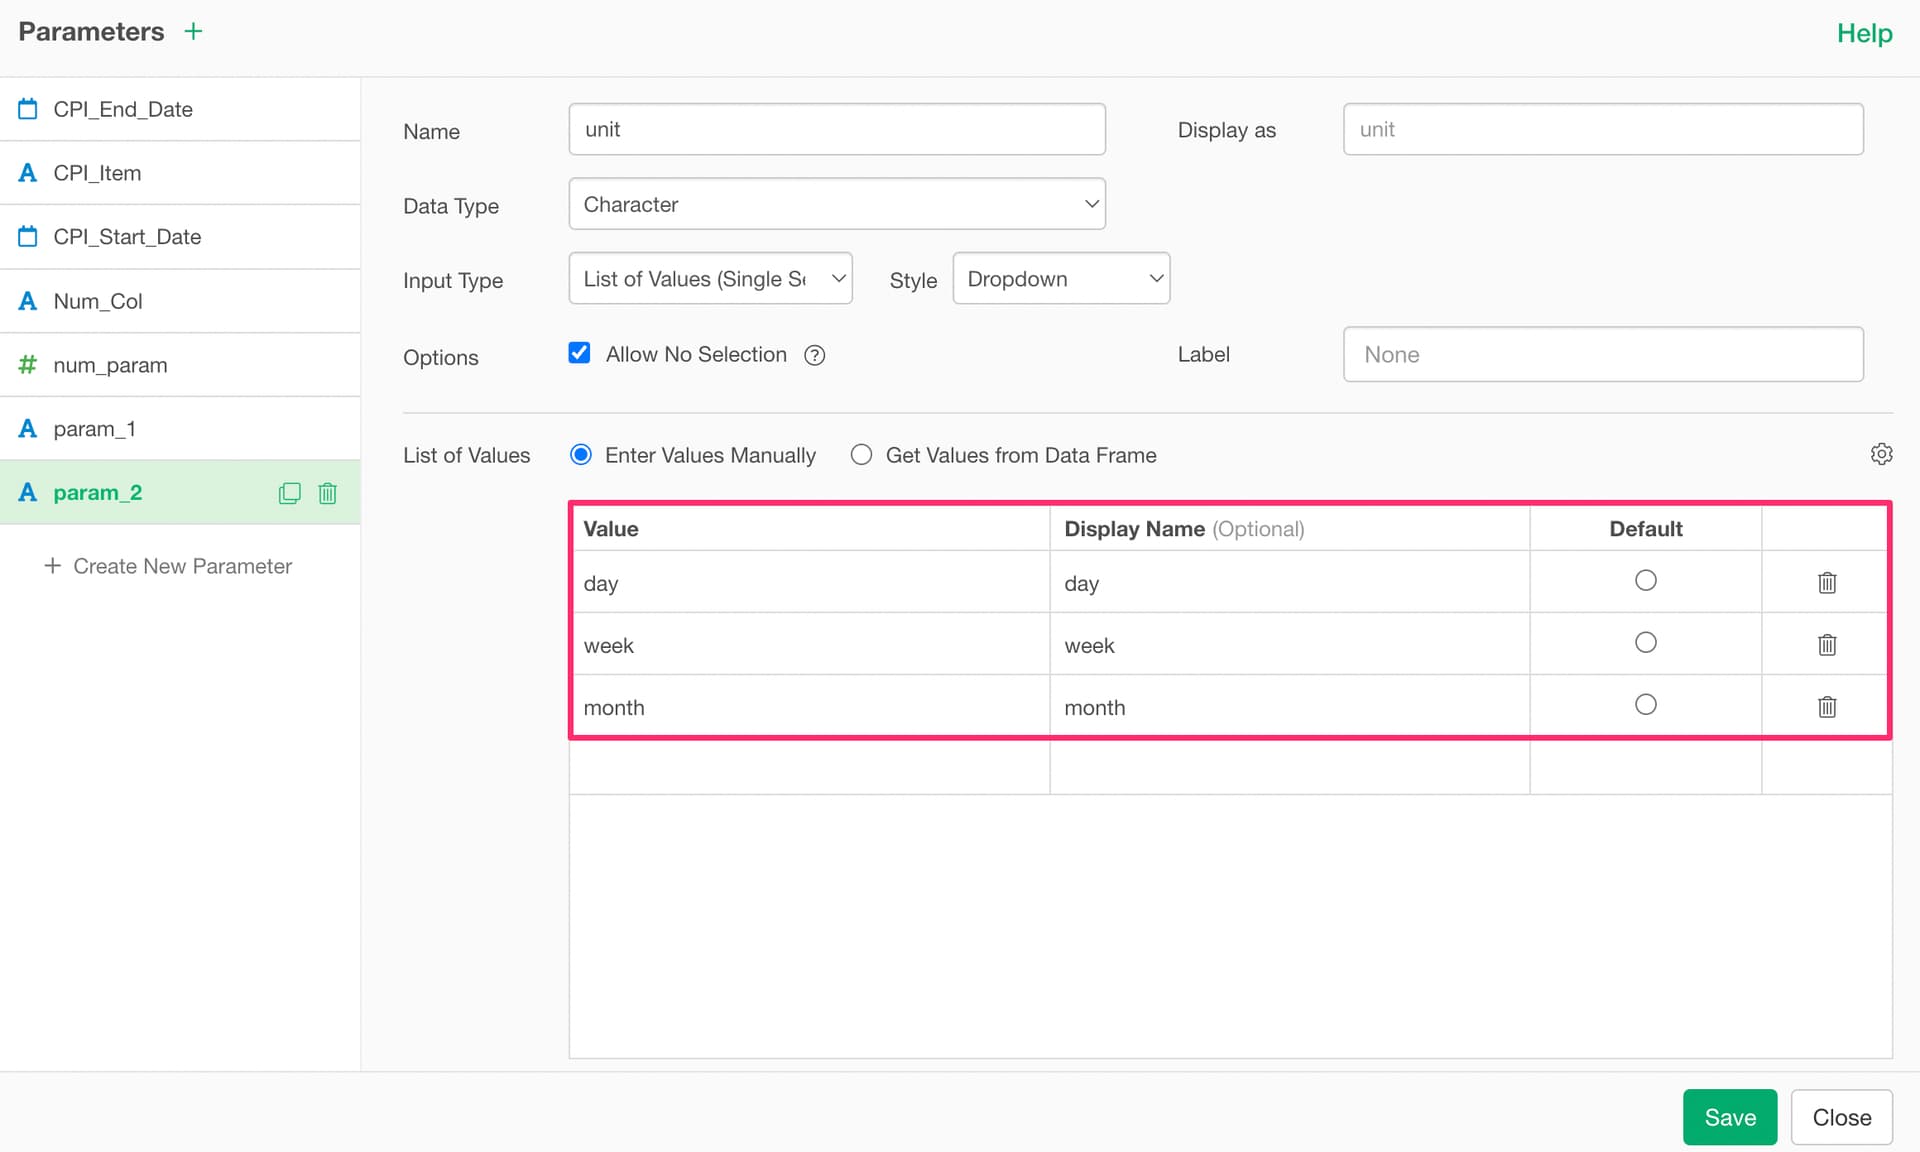
Set the parameter name as “unit” and the display name as “Date Unit”. Choose “Character” as the data type and “List of Values (Single Selection)” as the input type.
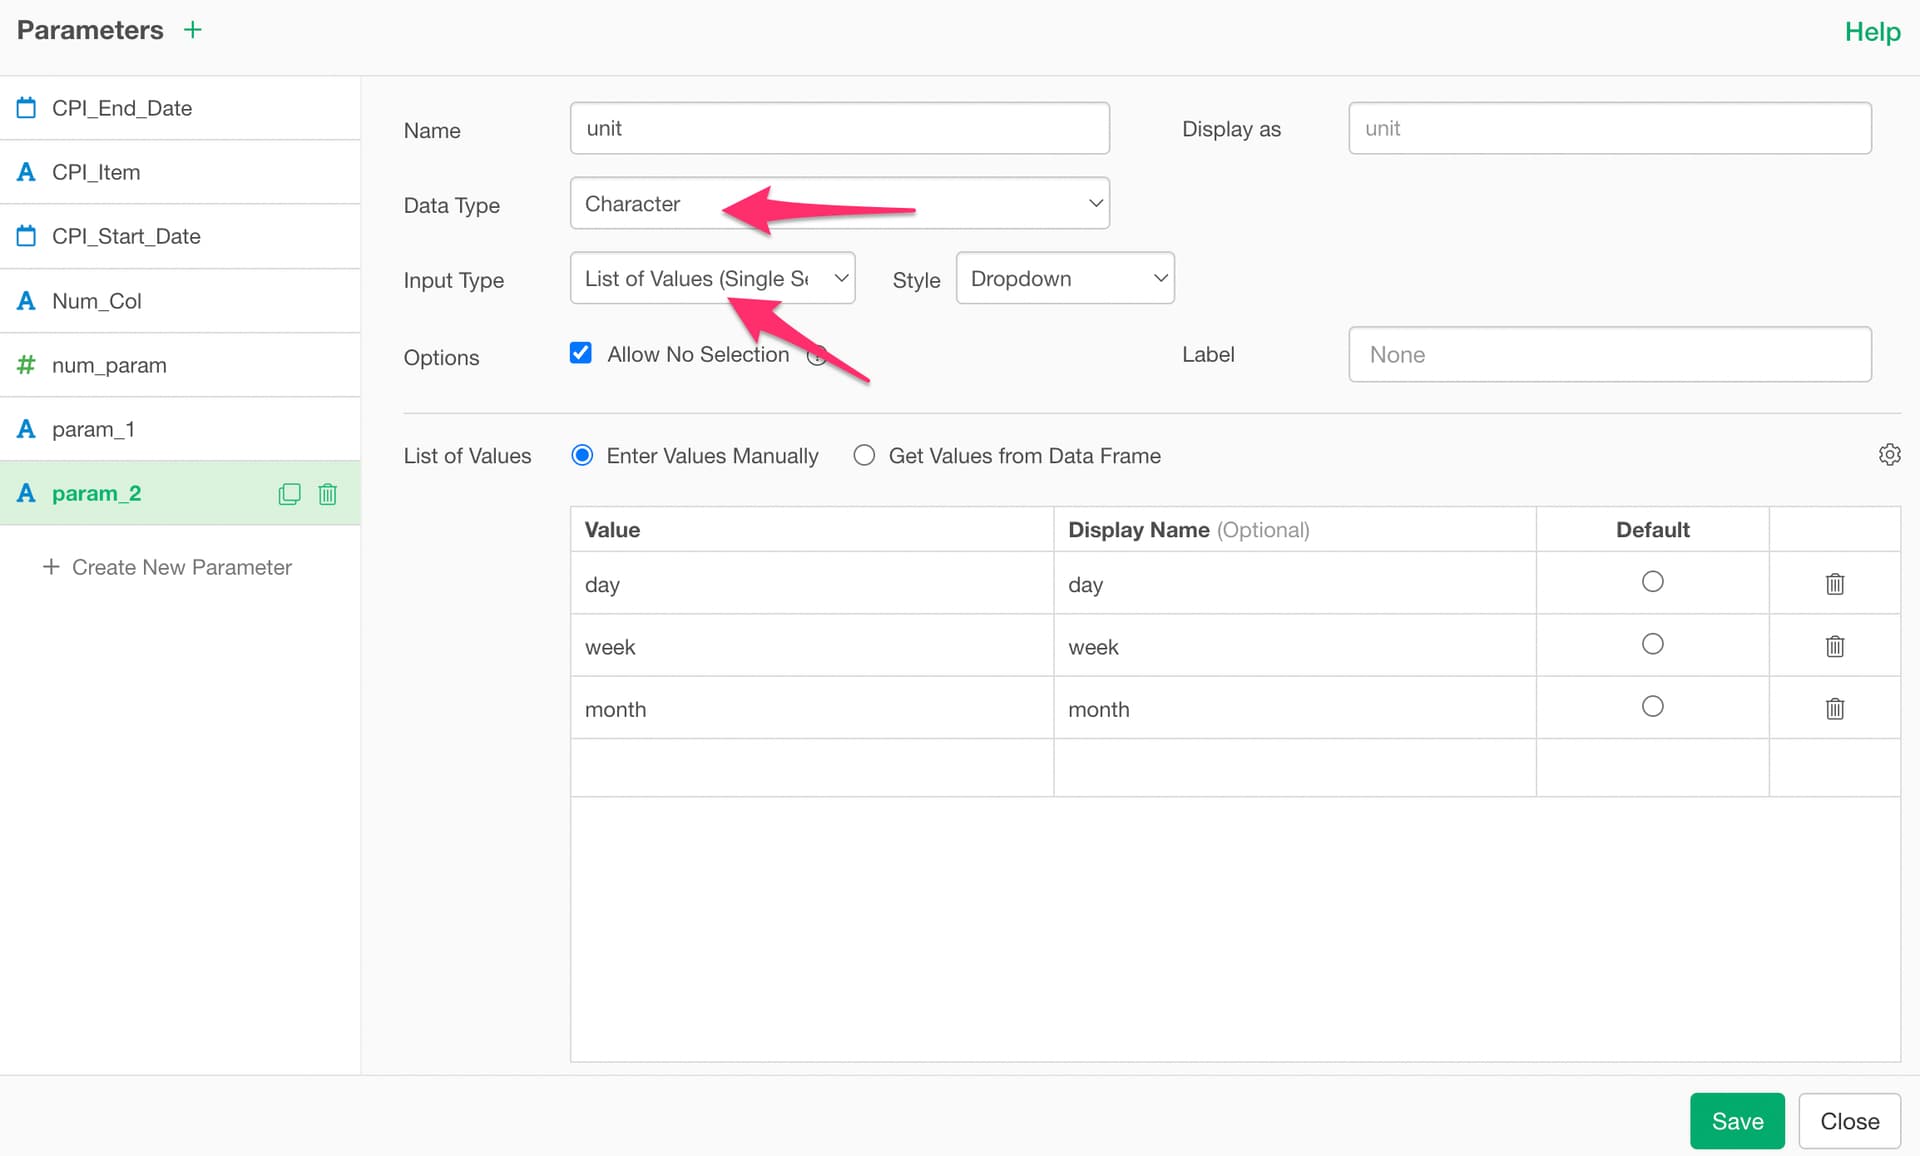
In the list of values, set the units that can be used with the floor_date function. Specifically, add “day”, “week”, “month”, and “year”.
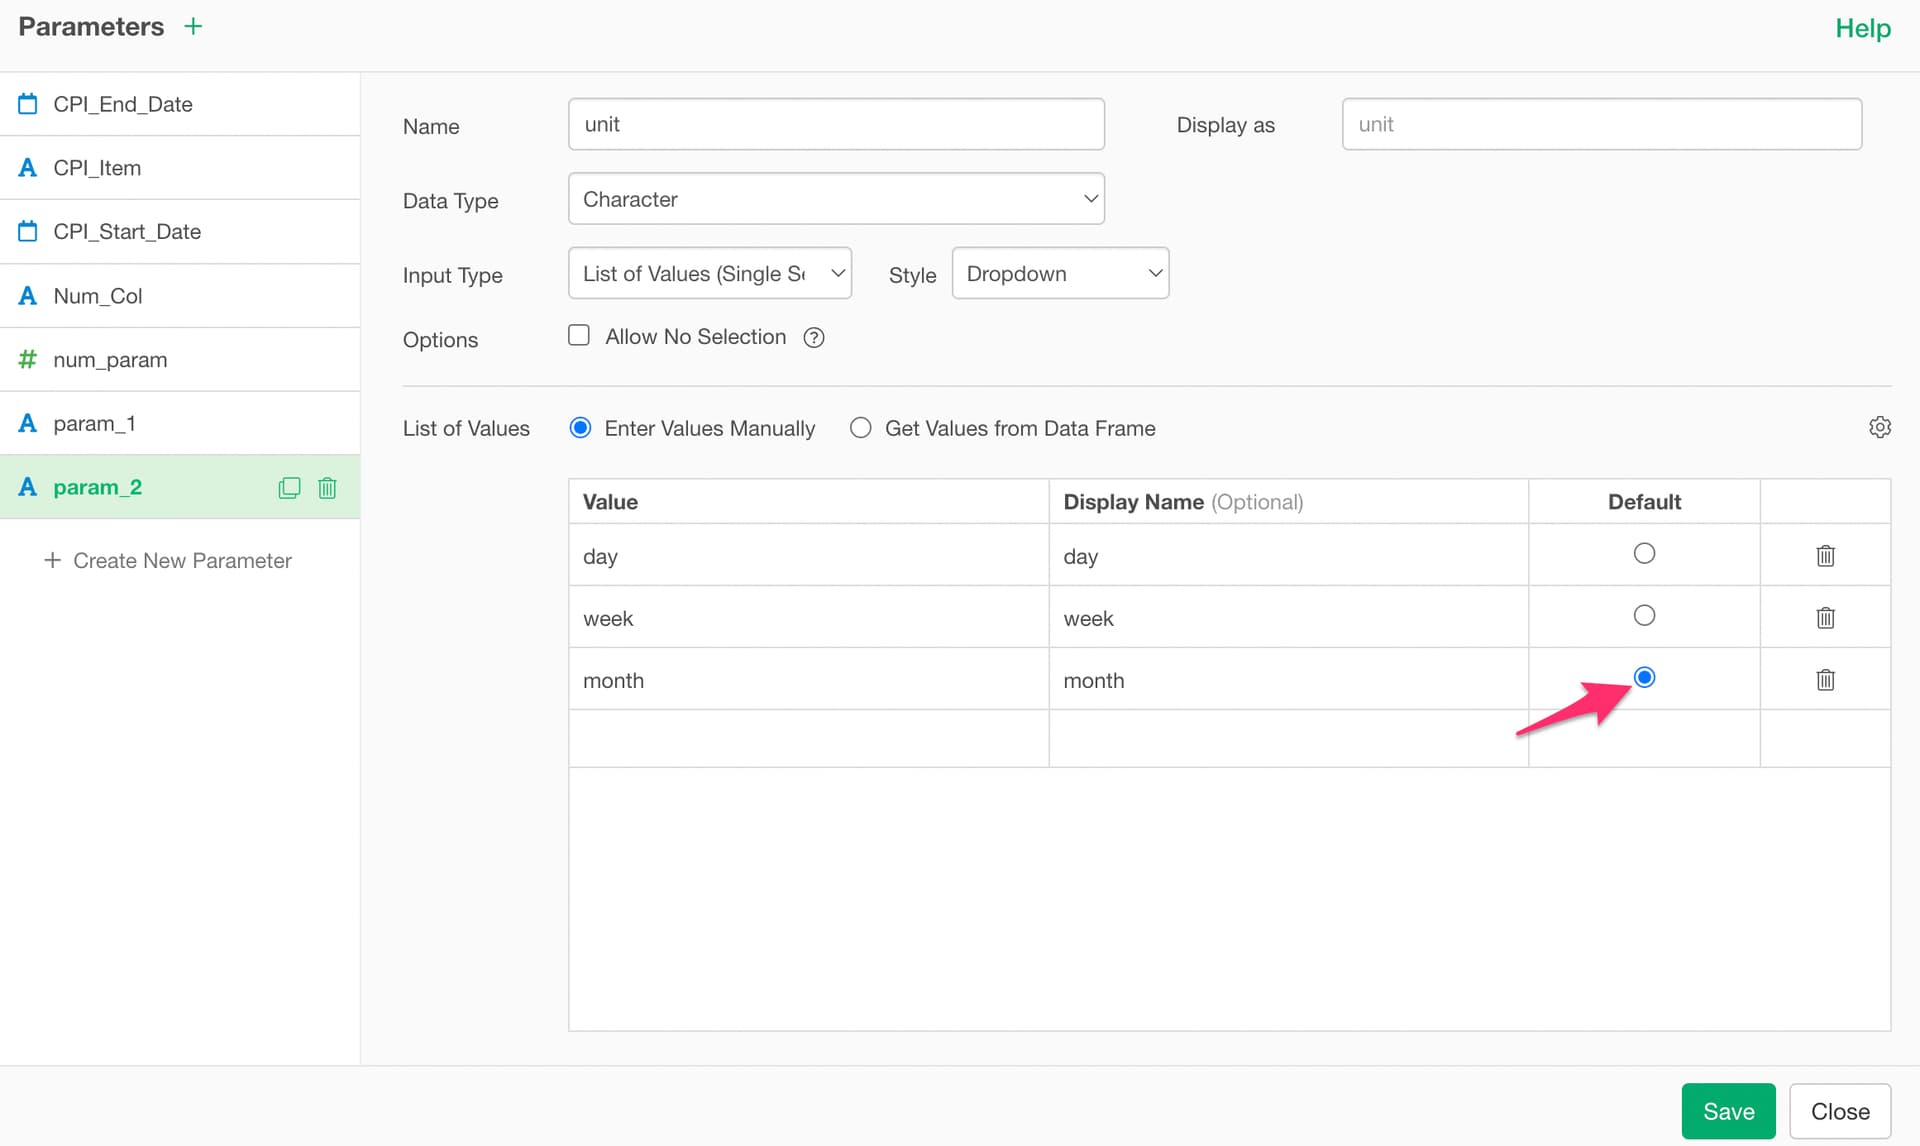
Set “month” as the default value and save the parameter. This will make the initial display show data on a monthly basis.
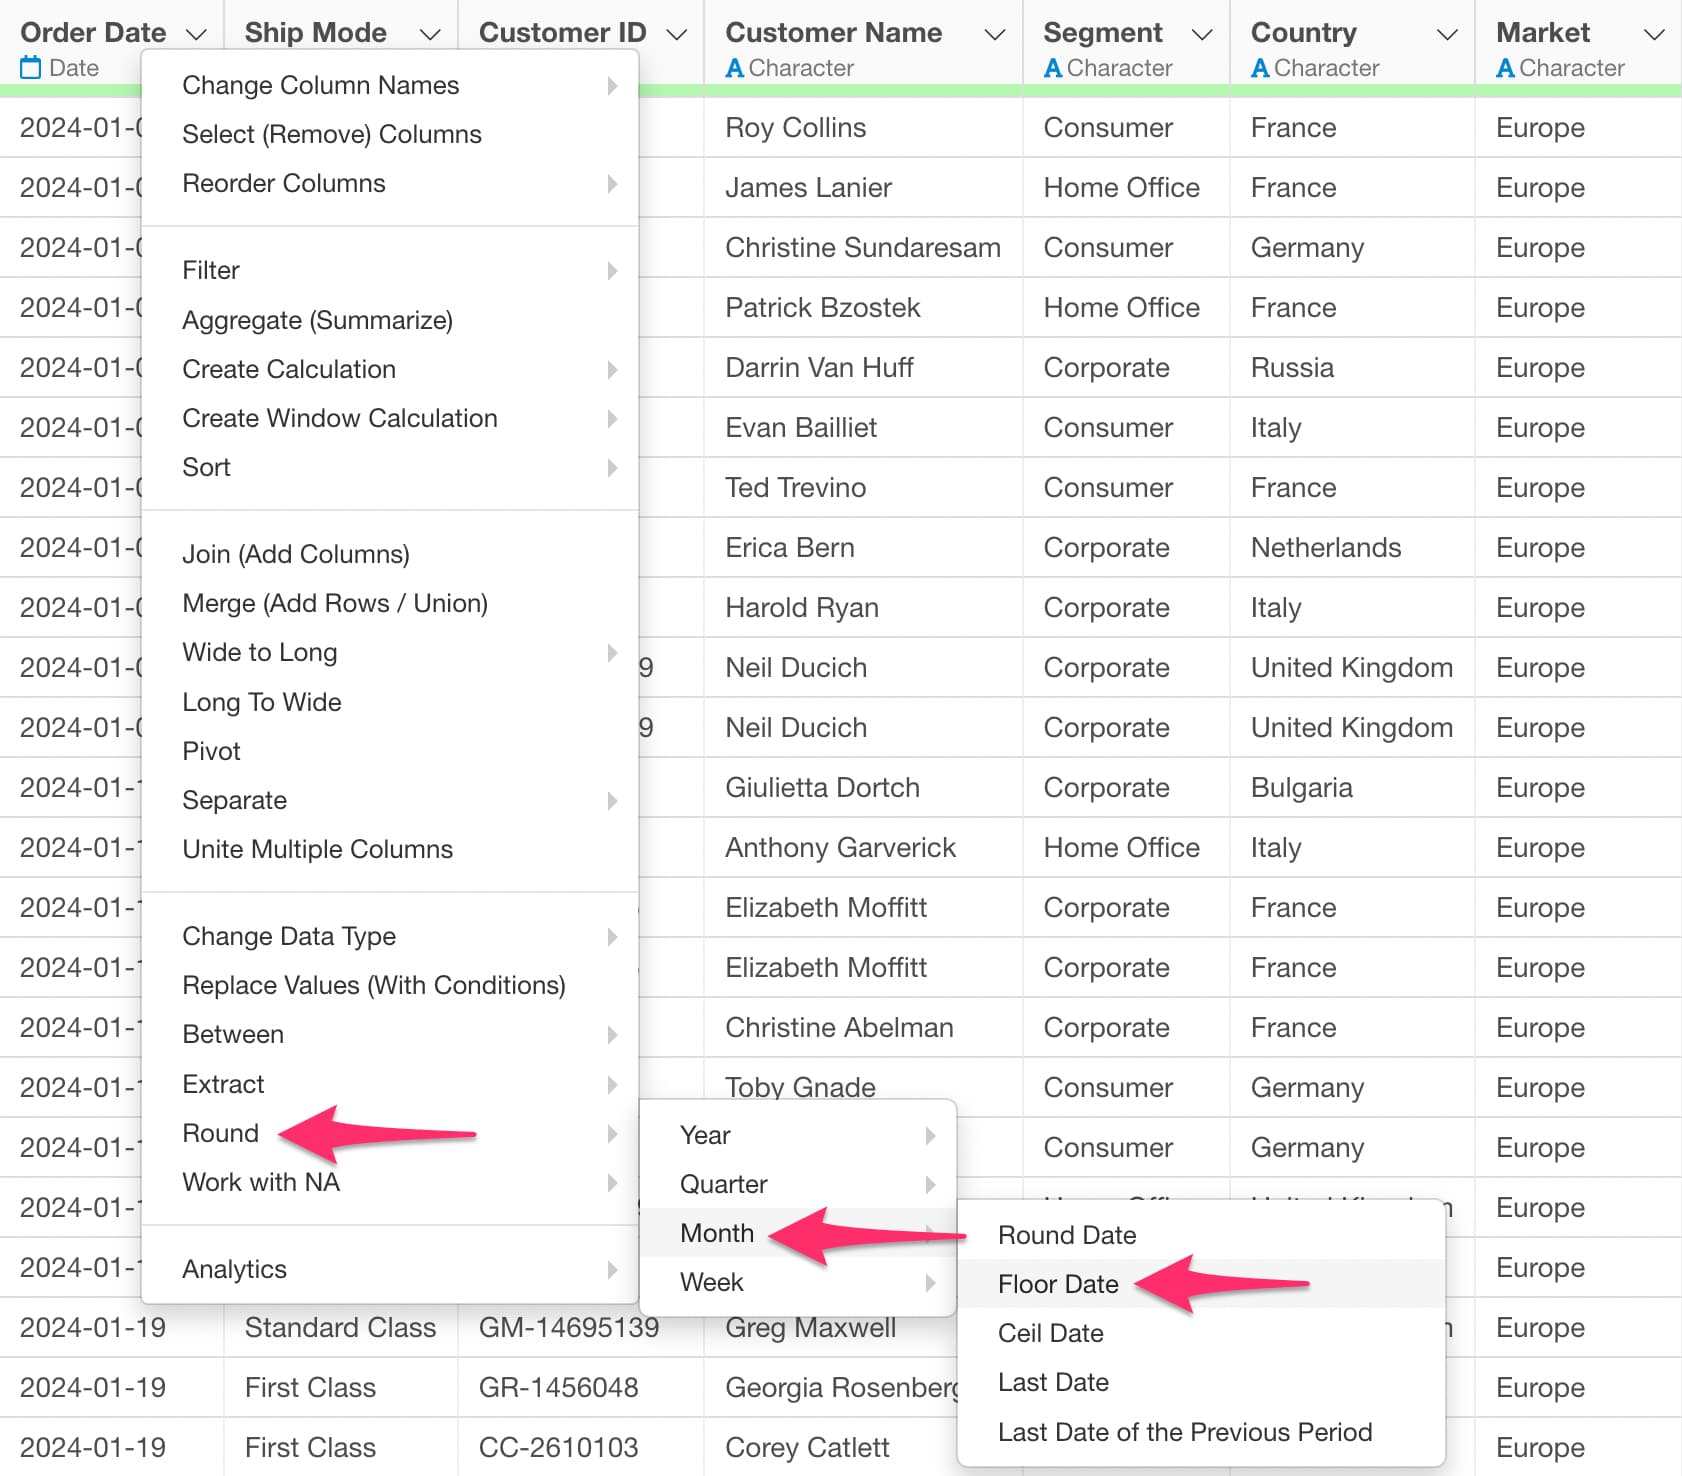
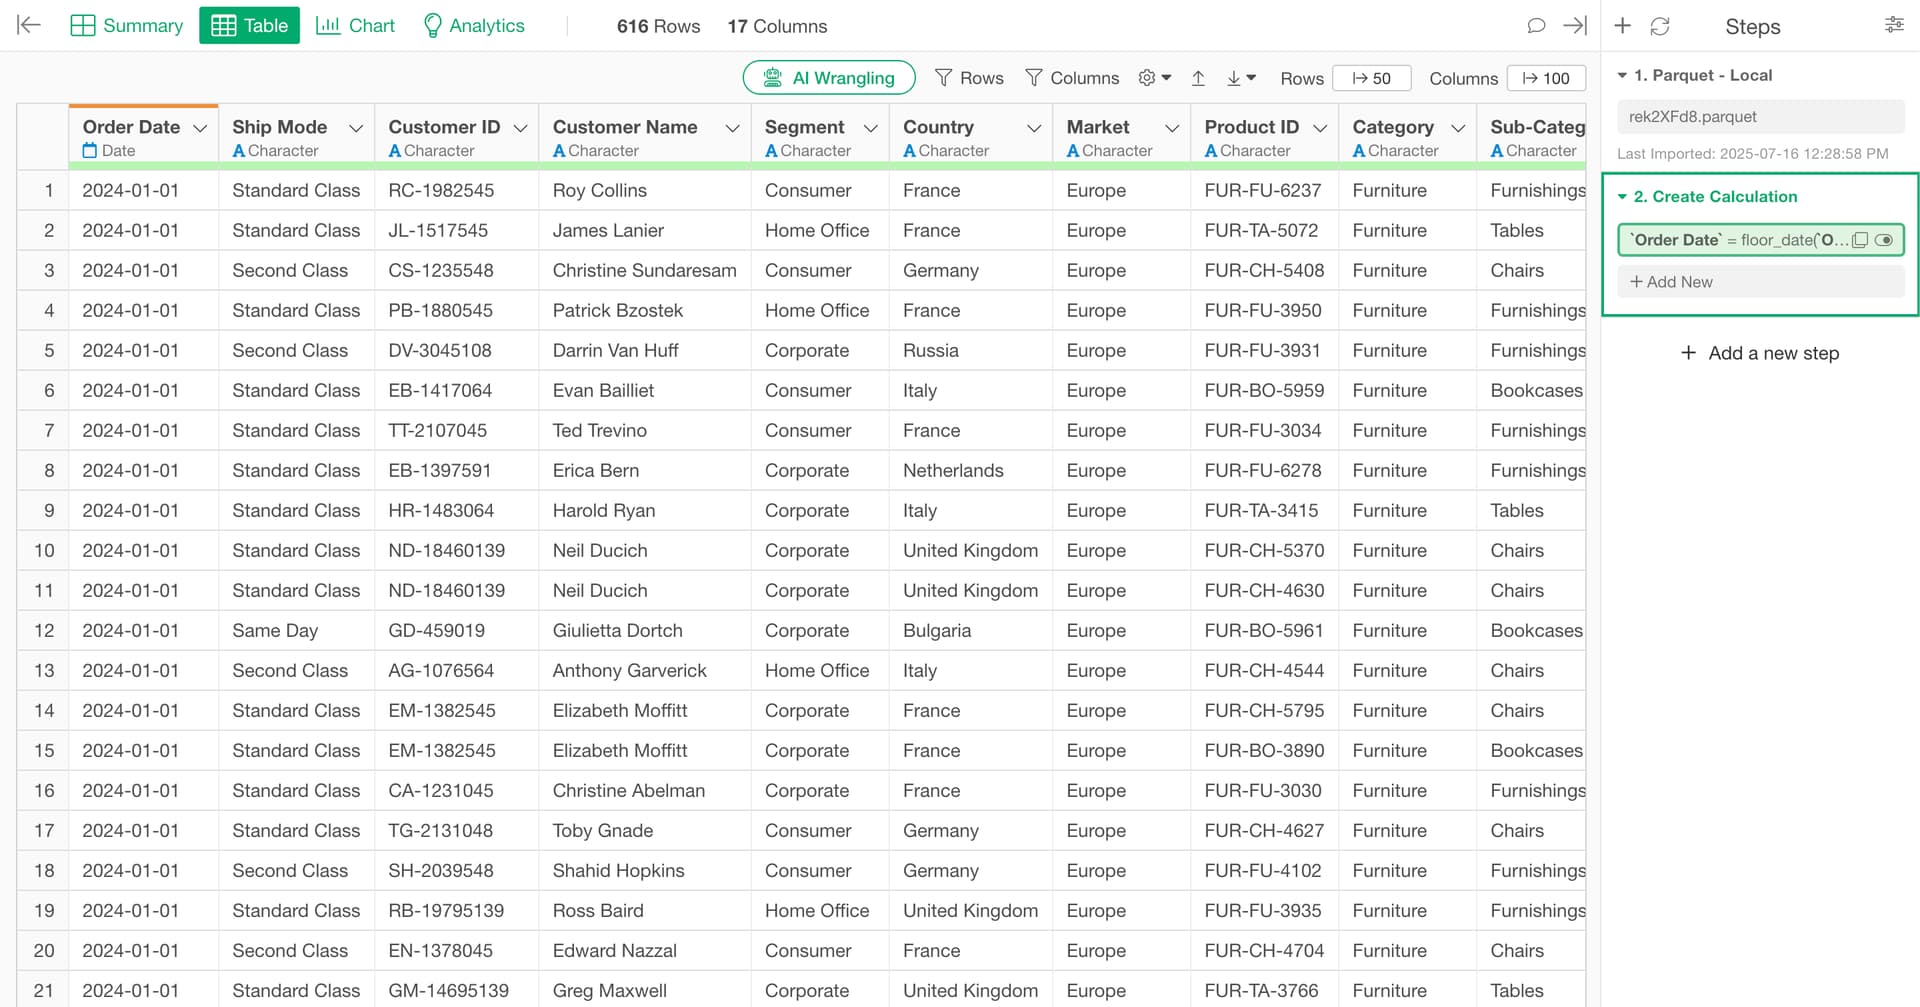
From the column header menu, select “Round” → “Month” → “Floor Date”.
When the Create Calculation dialog appears, select the unit argument part of the floor_date function and change it to reference the parameter instead of a fixed value. Delete the value of the unit argument and enter the “@” symbol. This will display a list of available parameters, so select the “unit” parameter you created earlier.
This will make the floor_date function look like this:
floor_date(`Order Date`, unit = @{unit})
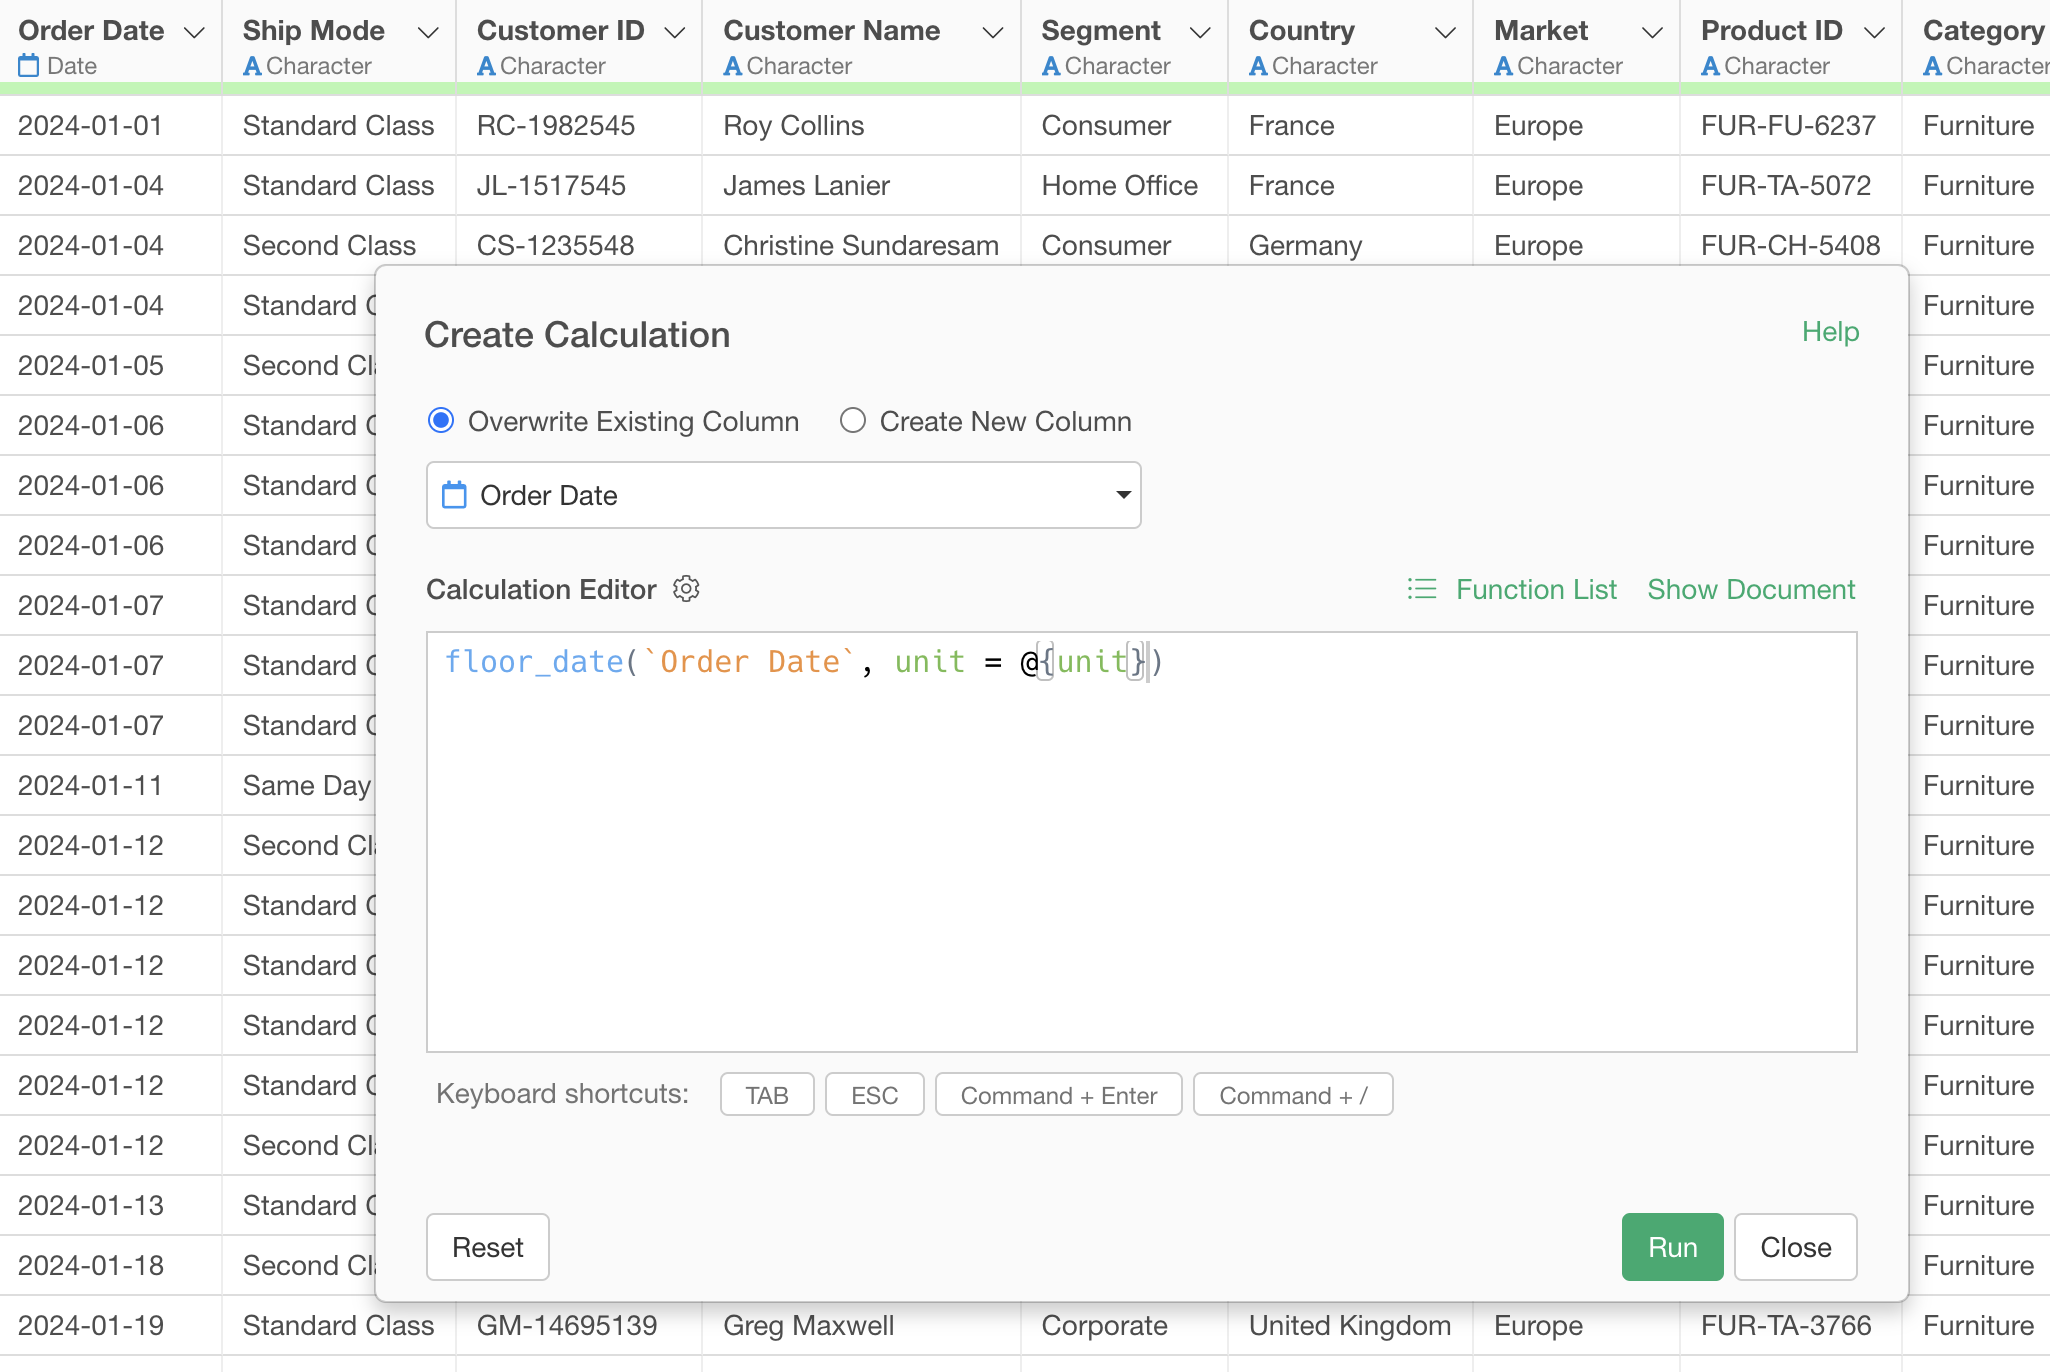
Click the Execute button to apply the changes. With this setting, the date rounding unit will dynamically change according to the parameter value.
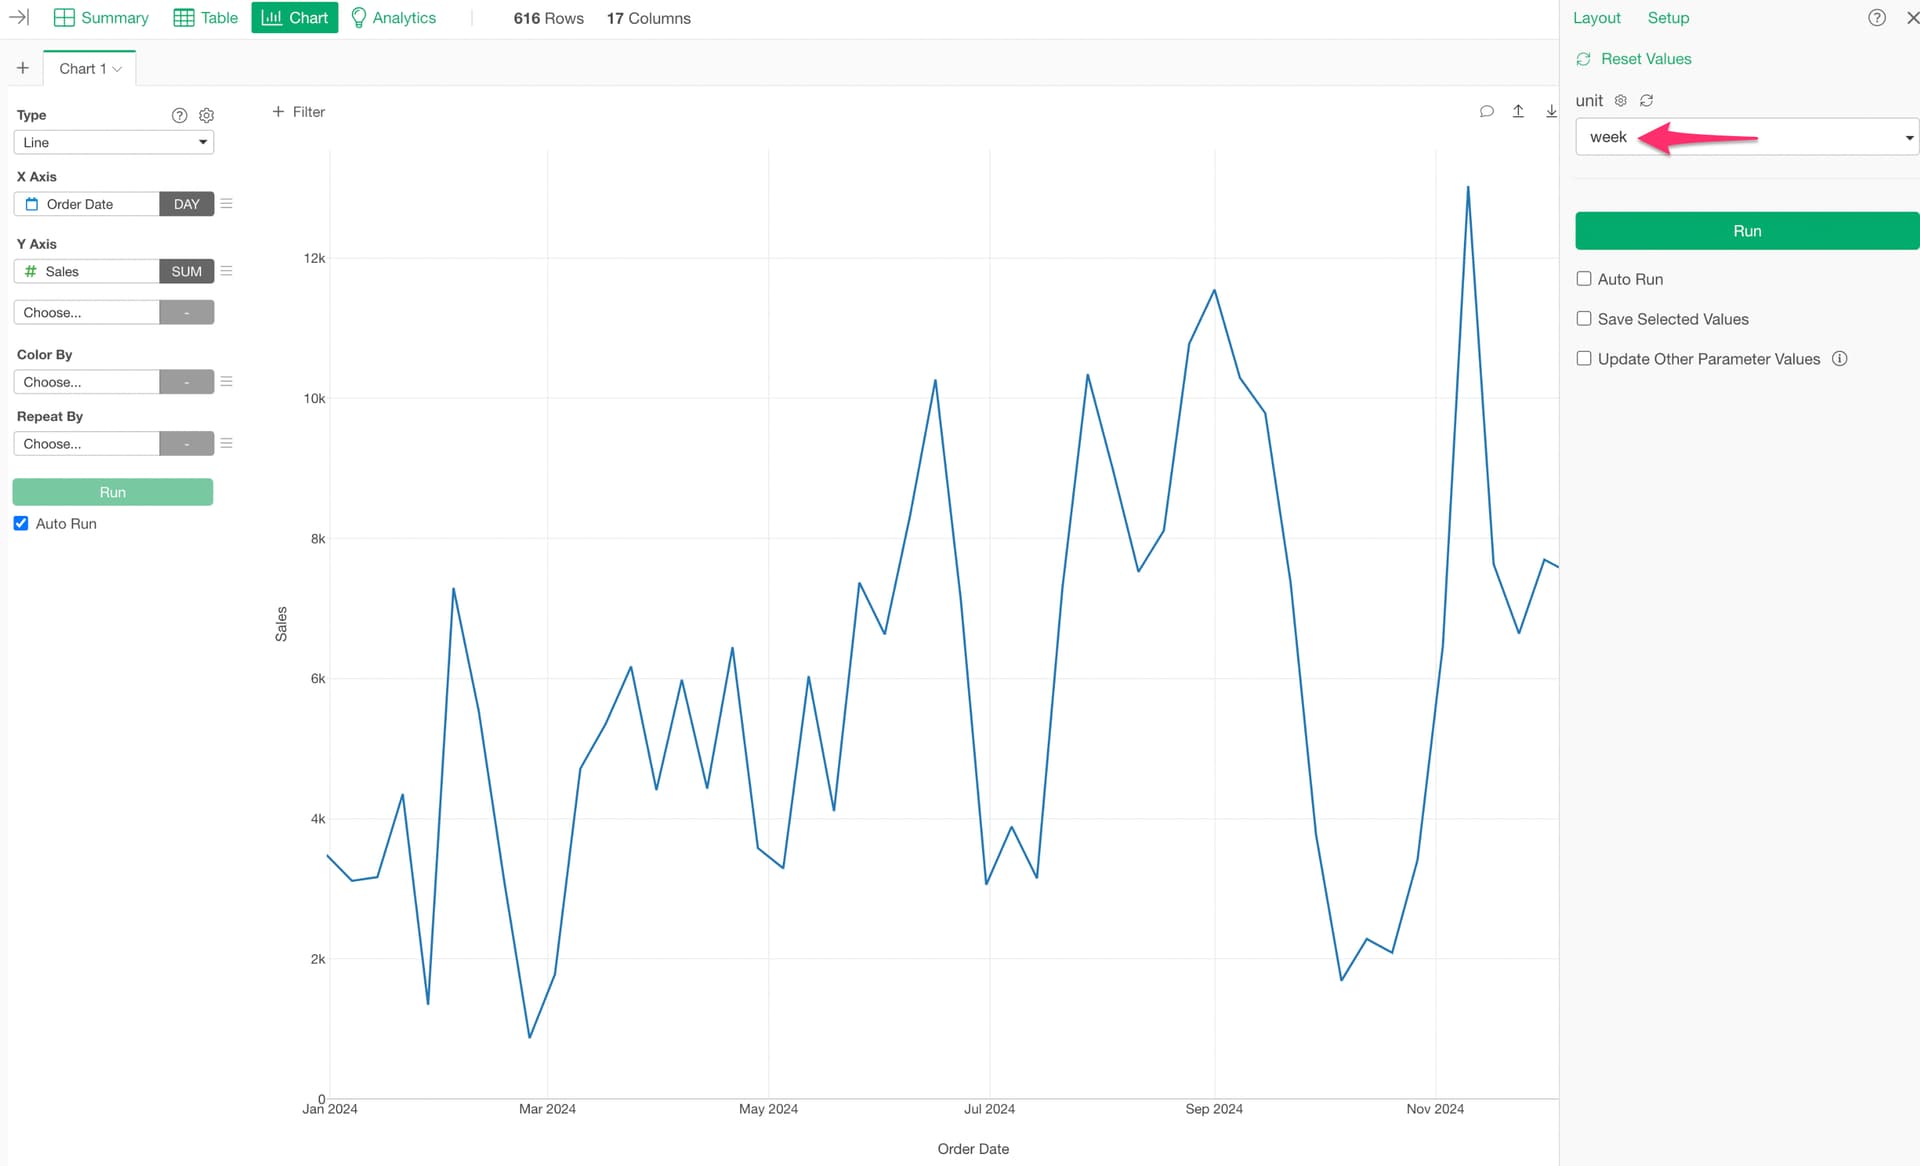
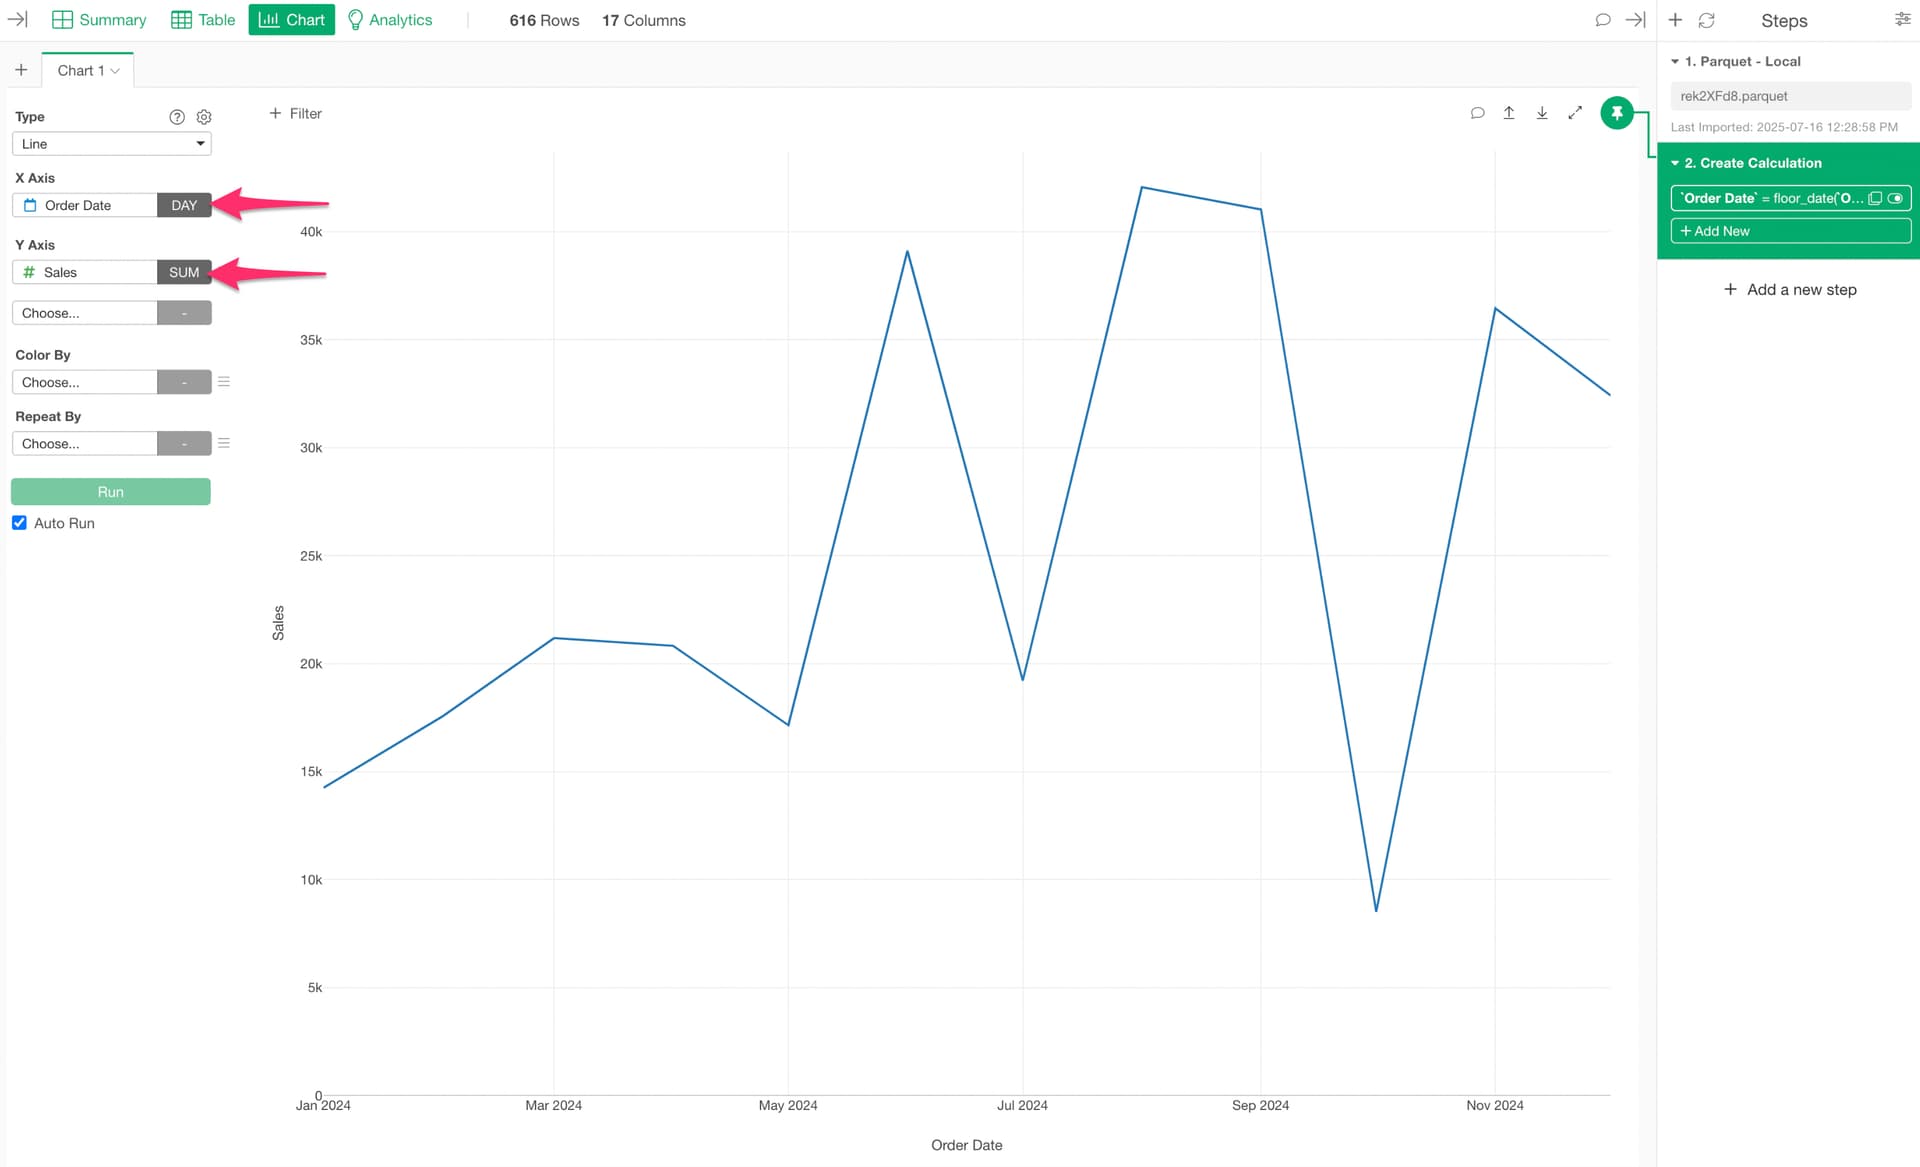
Create a line chart in the chart view. For this, use the date column that uses the floor_date function you created earlier for the X-axis.
When you open the parameter window,
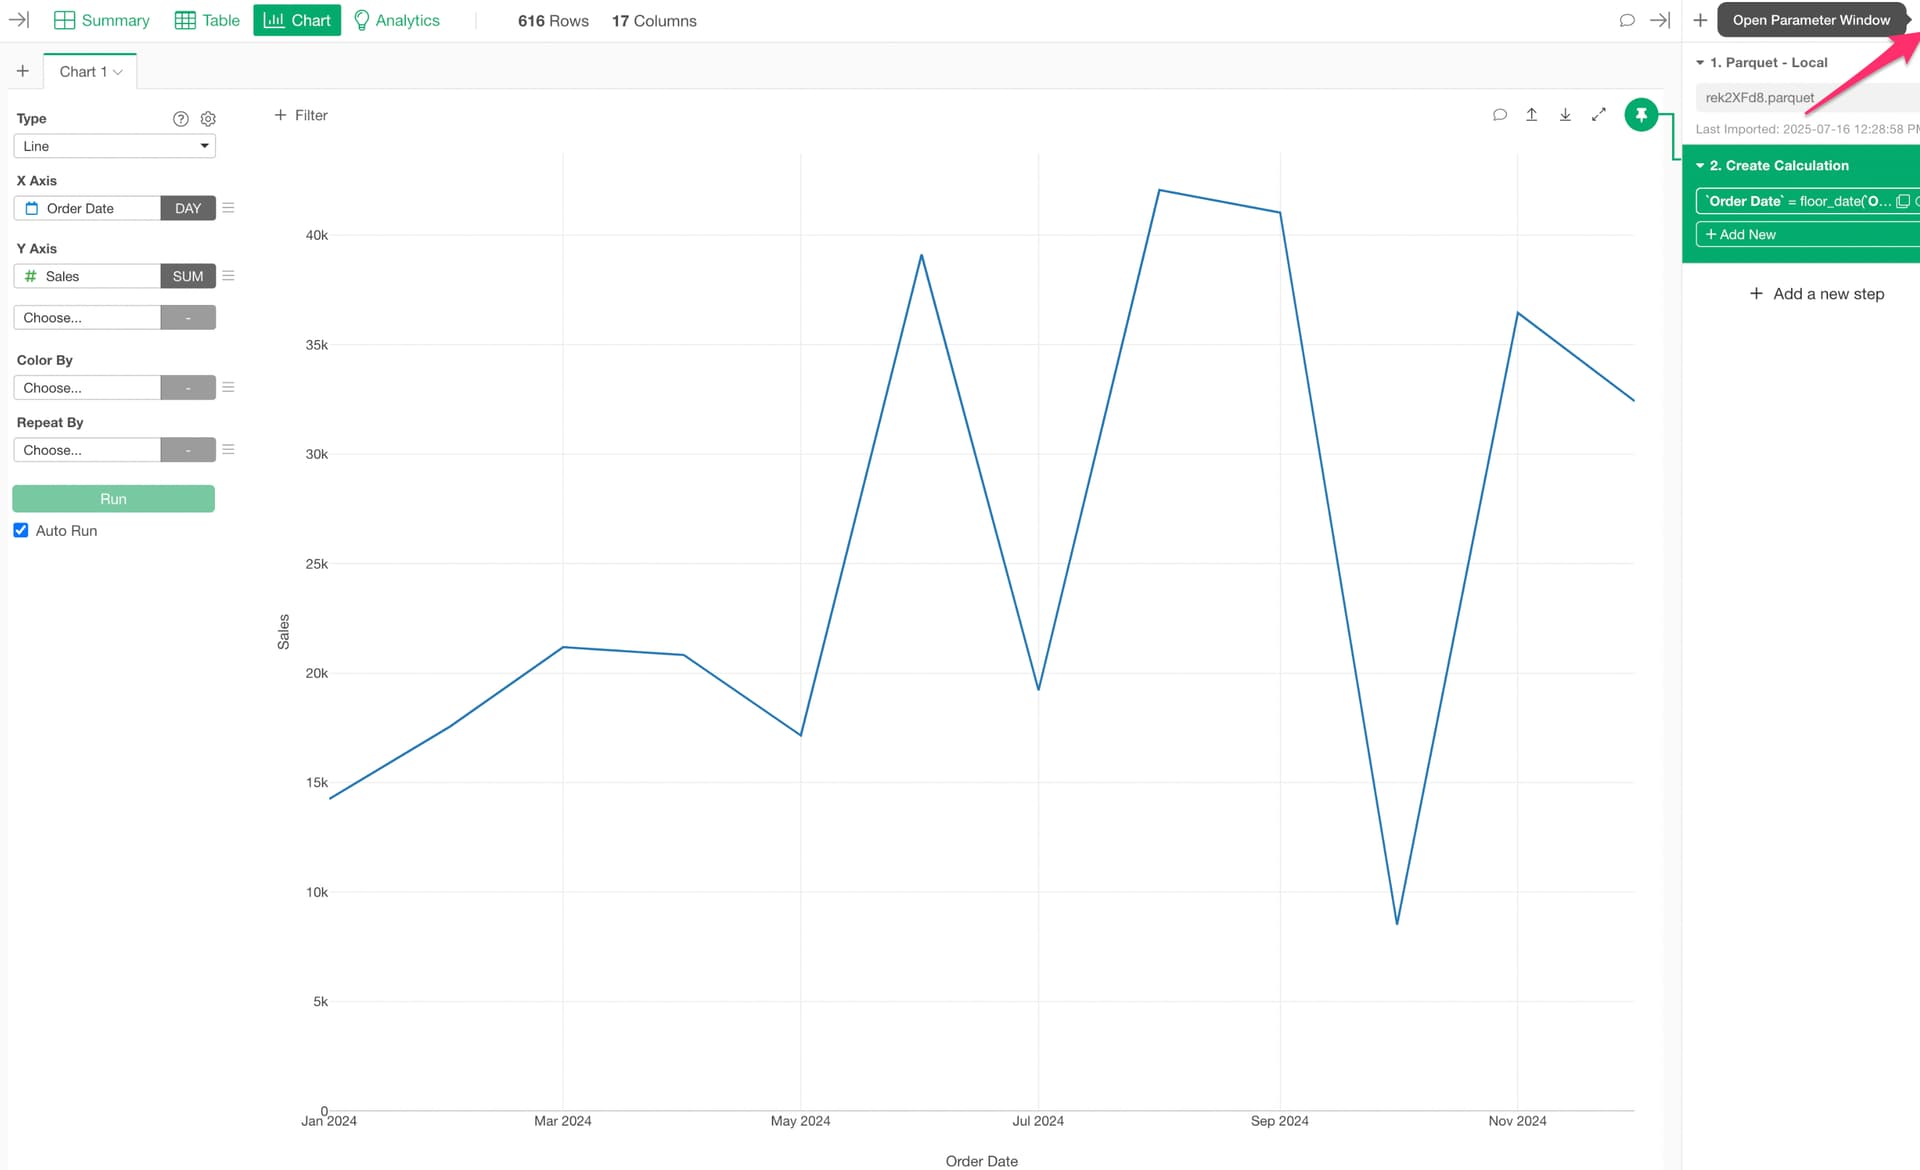
the “Date Unit” parameter you set will be displayed, and you can change the chart display unit in real-time by changing the parameter value.