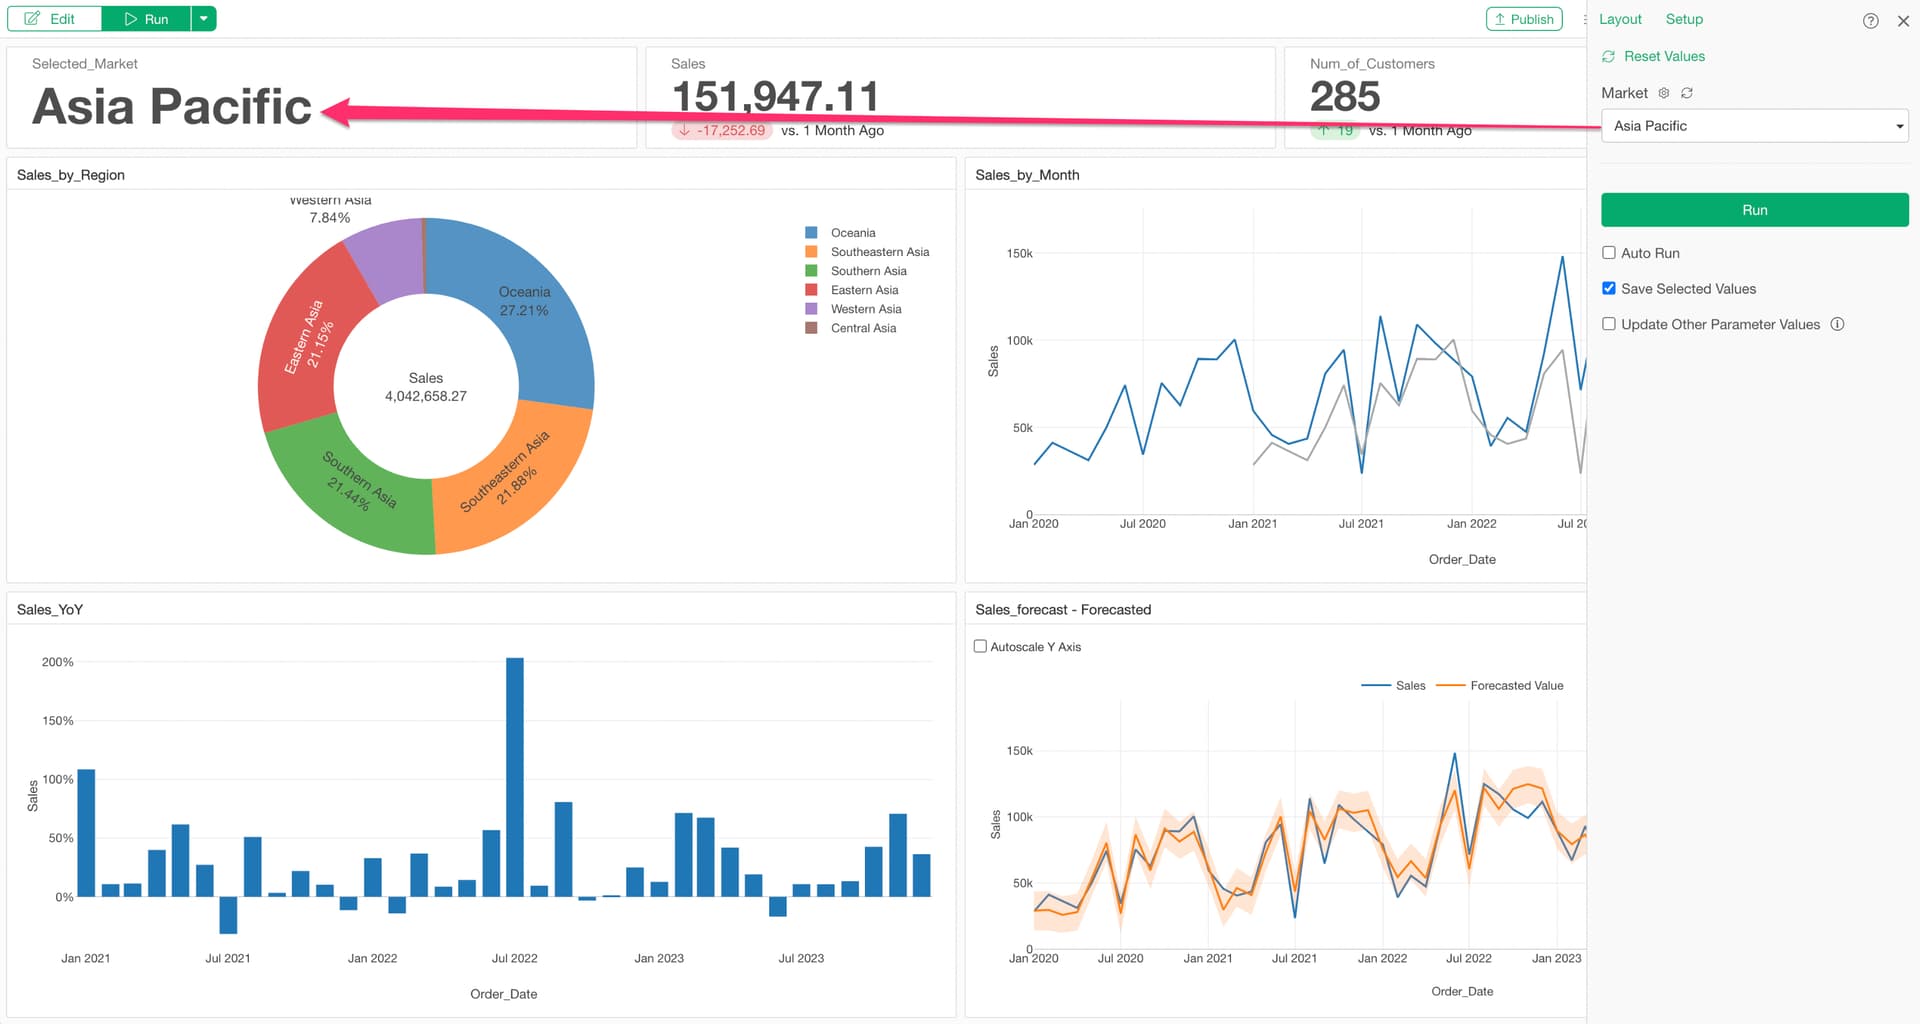
When you want to create a number chart to display the value (string) of a selected parameter in a dashboard like this:
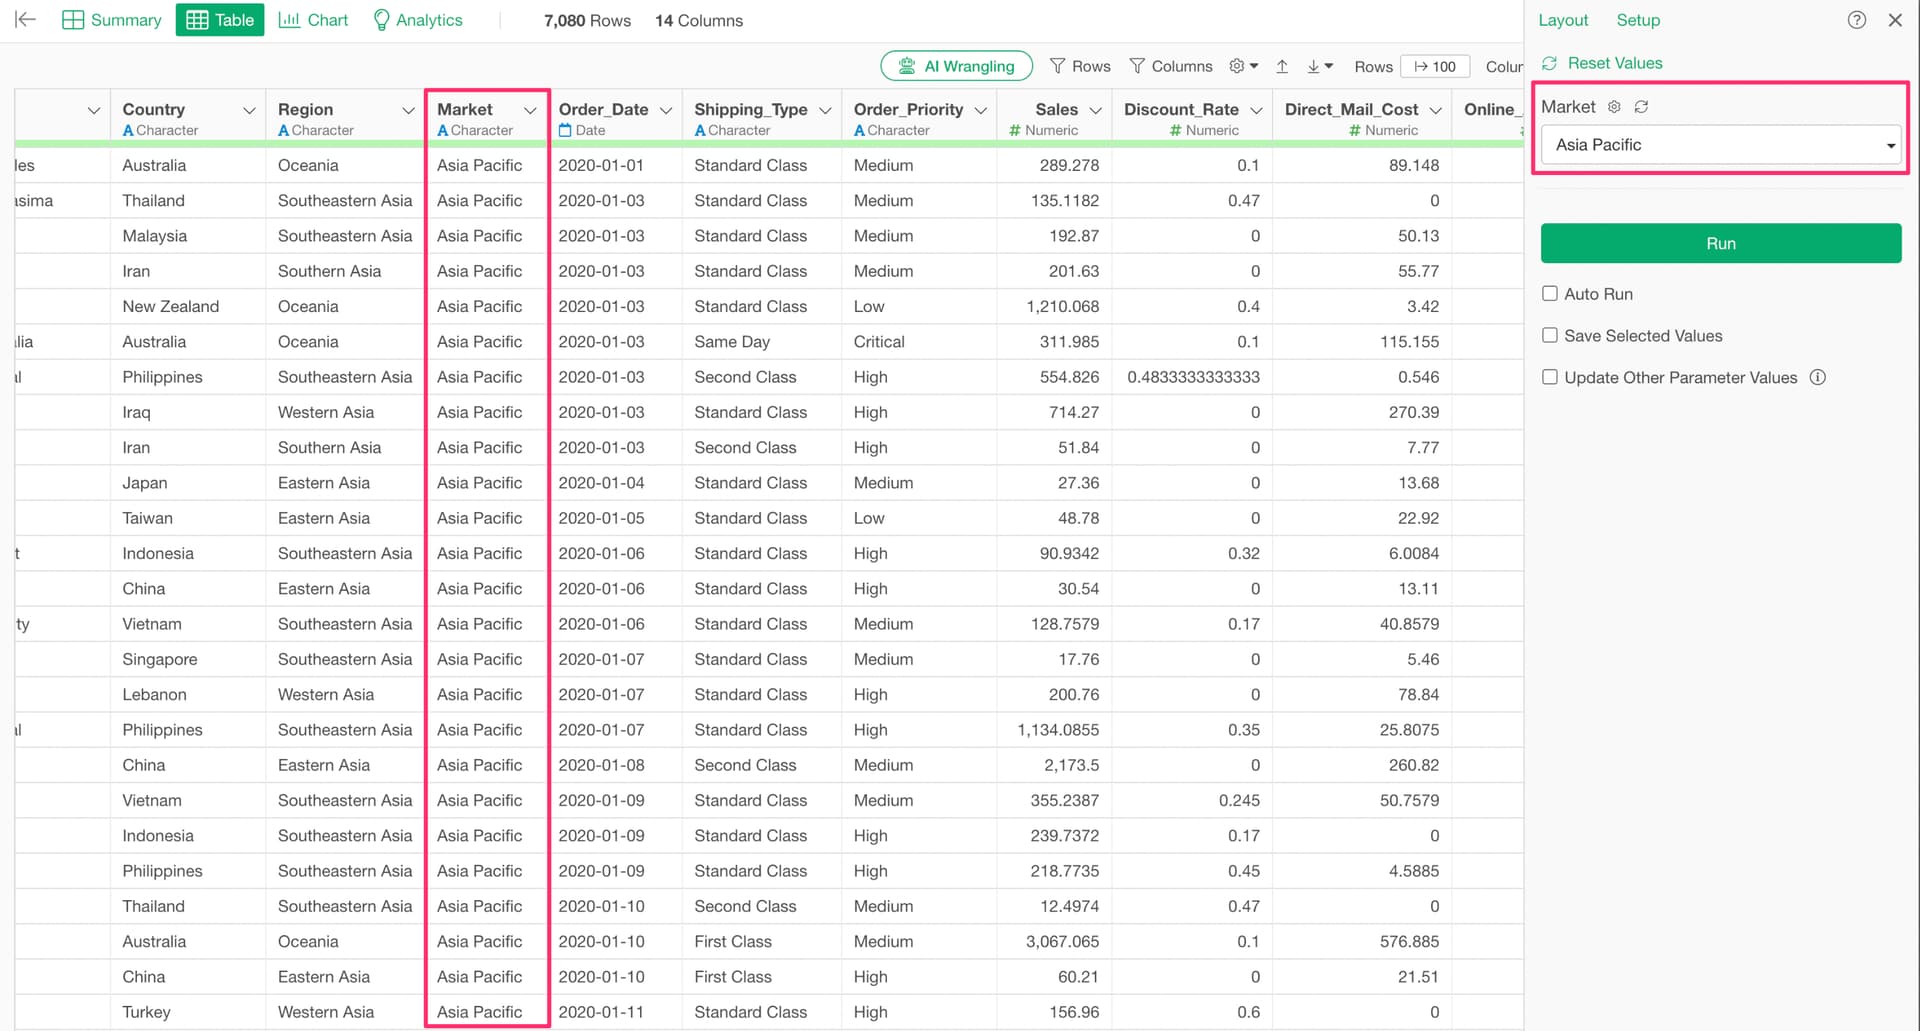
Assume the parameter has already been created and applied in the filter.
In the following example, a filter using a parameter is applied to the Market column.
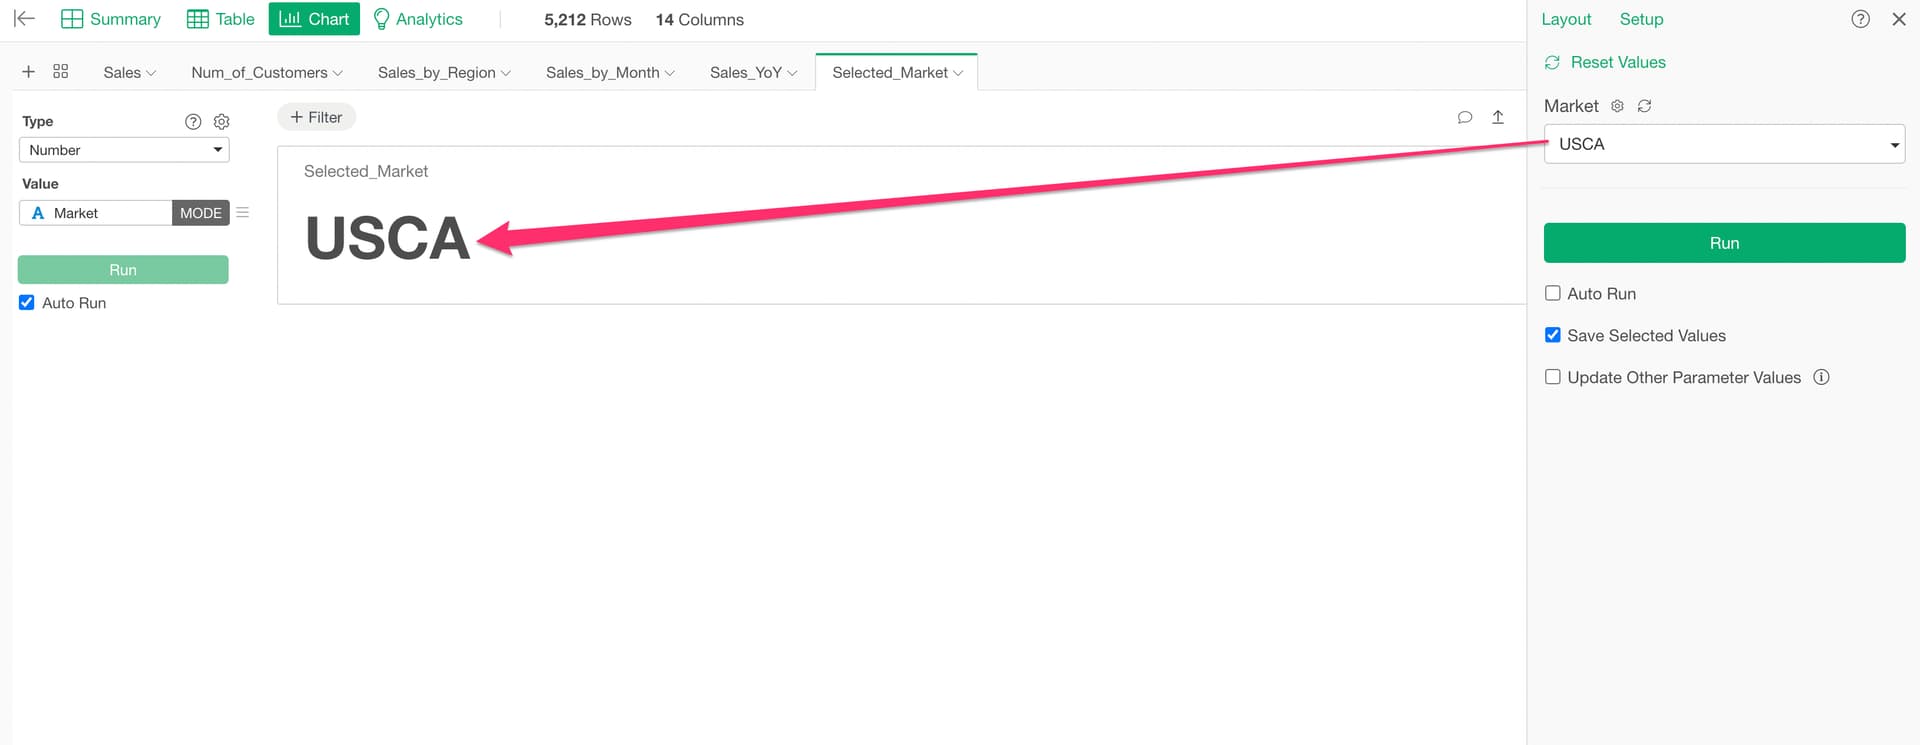
From the chart view, select “Number” as the type and choose the column that uses the parameter.
For the aggregation function, use Mode or First.
Since this column contains only one value due to the parameter, any aggregation function that returns the value as-is will work.
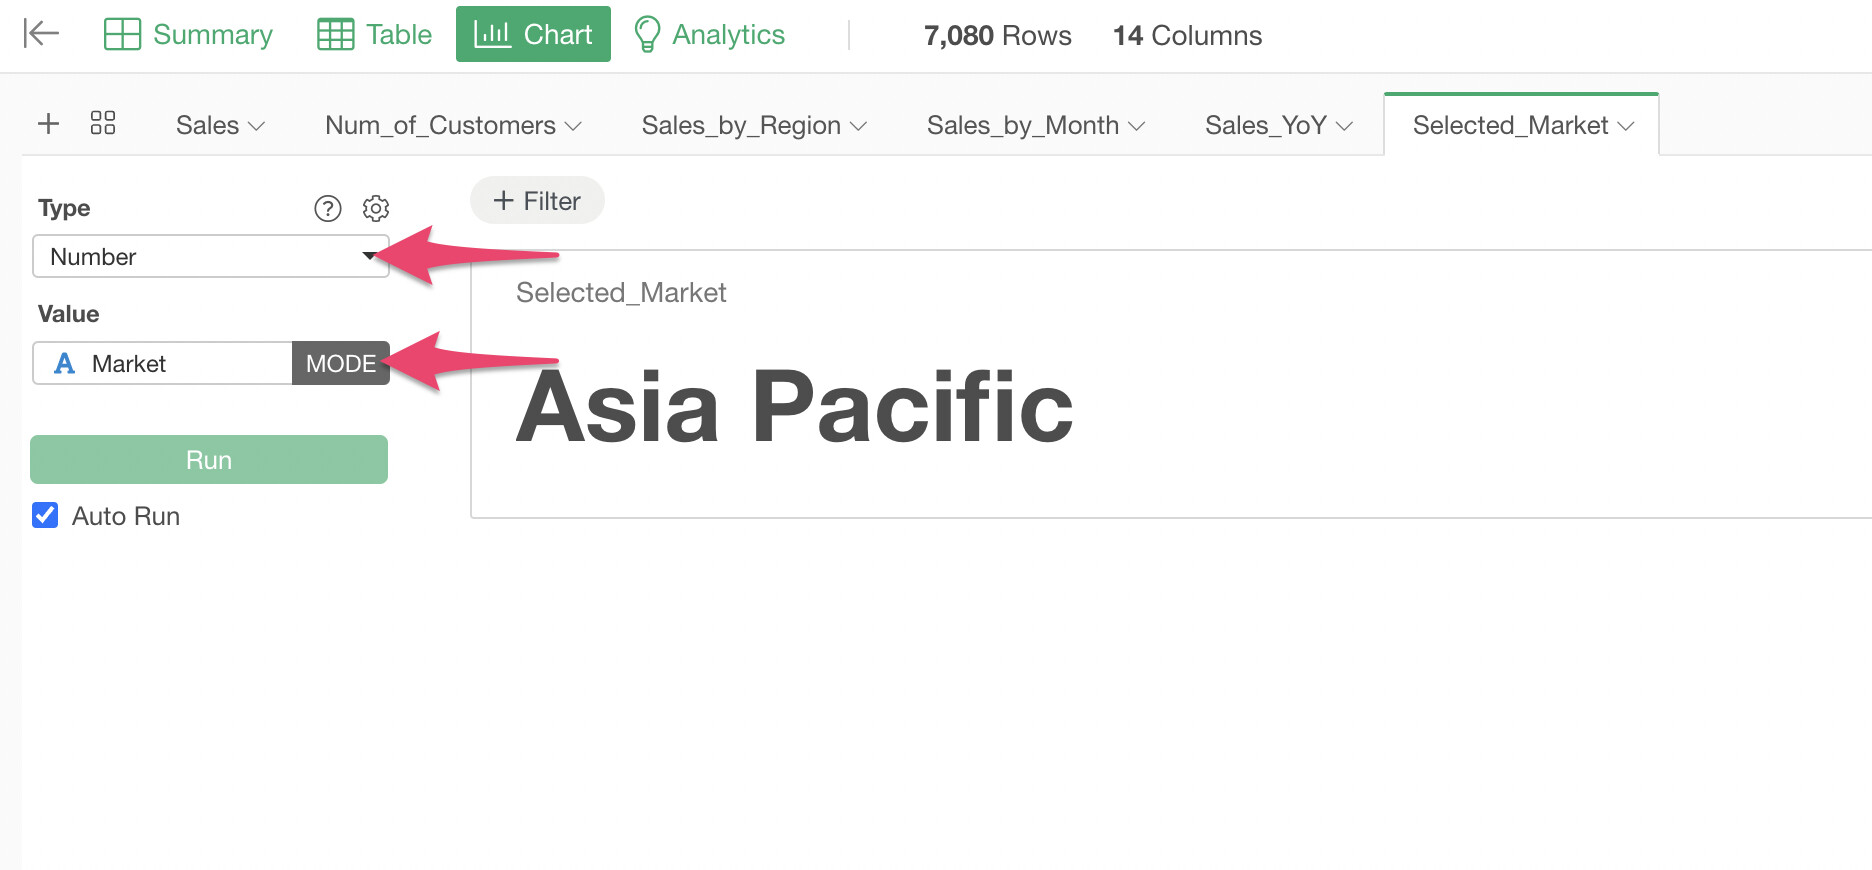
This allows you to create a number chart that displays the string according to the value selected in the parameter.