My data is currently has the following columns:
- DateTime
- Session ID
- Name
- Value
I would like a new data frame that flips the rows into columns. For each unique ‘Session Id’, I would like to make a single row. There are 30 unique values in ‘Name’ column. Each of these values would become a column header, and the cell would be set to the value of the ‘Value’ column.
Any thoughts on how I can manage this?
Thanks,
Andy
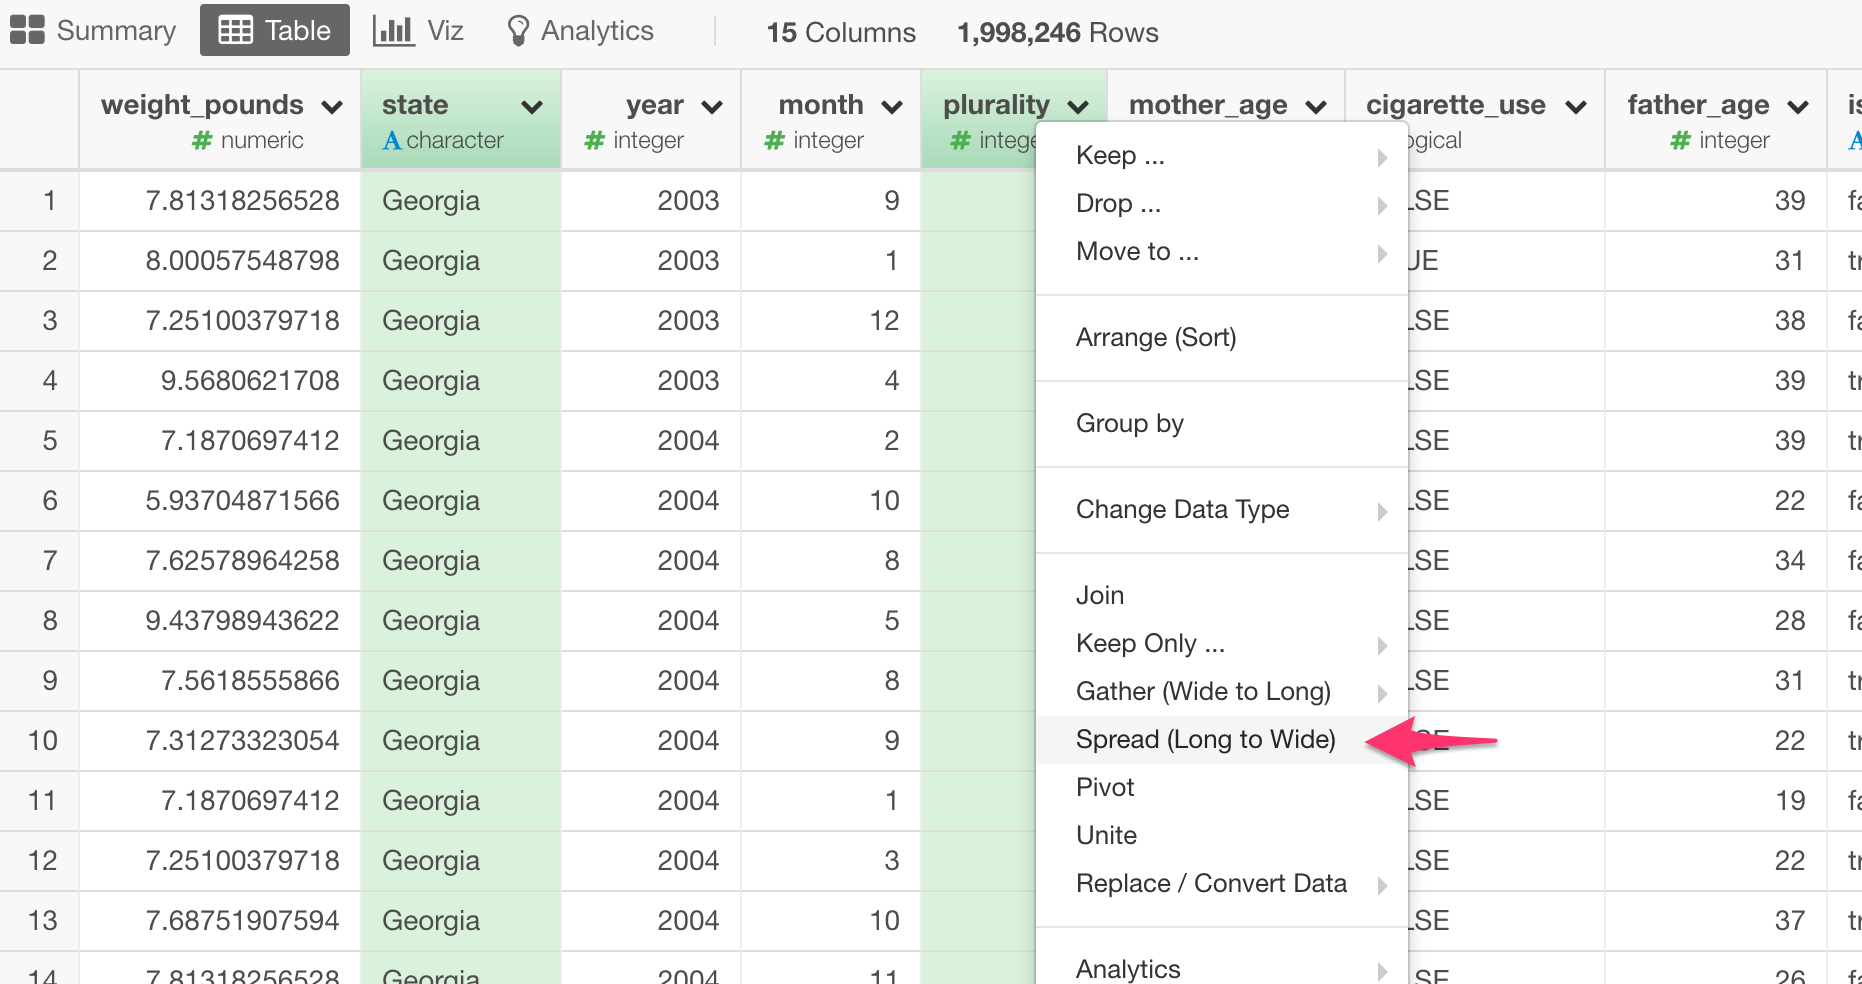
I found a solution to my own issue. I can use the Spread() function which does what I want. I did have to remove my dateTime column as it was preventing the function from flattening all sessionID’s into a single row.
I do have a follow-up issue. In some cases I have more than one value (row) for a specific sessionId and name. I need to condense the different values into a comma separated list of values, so that I only have a single row for every sessionId/name.
Any ideas?
OK, so I have figured out how to condense the data. First I grouped the data by Session ID and then Name, then I used
mutate(Value = paste(Value, collapse=","))
followed by
distinct()
And that did the trick.
Andrew,
Sorry for getting back to you late on this.
Yes, you can use Spread command to spread a key-value pair columns to multiple columns .
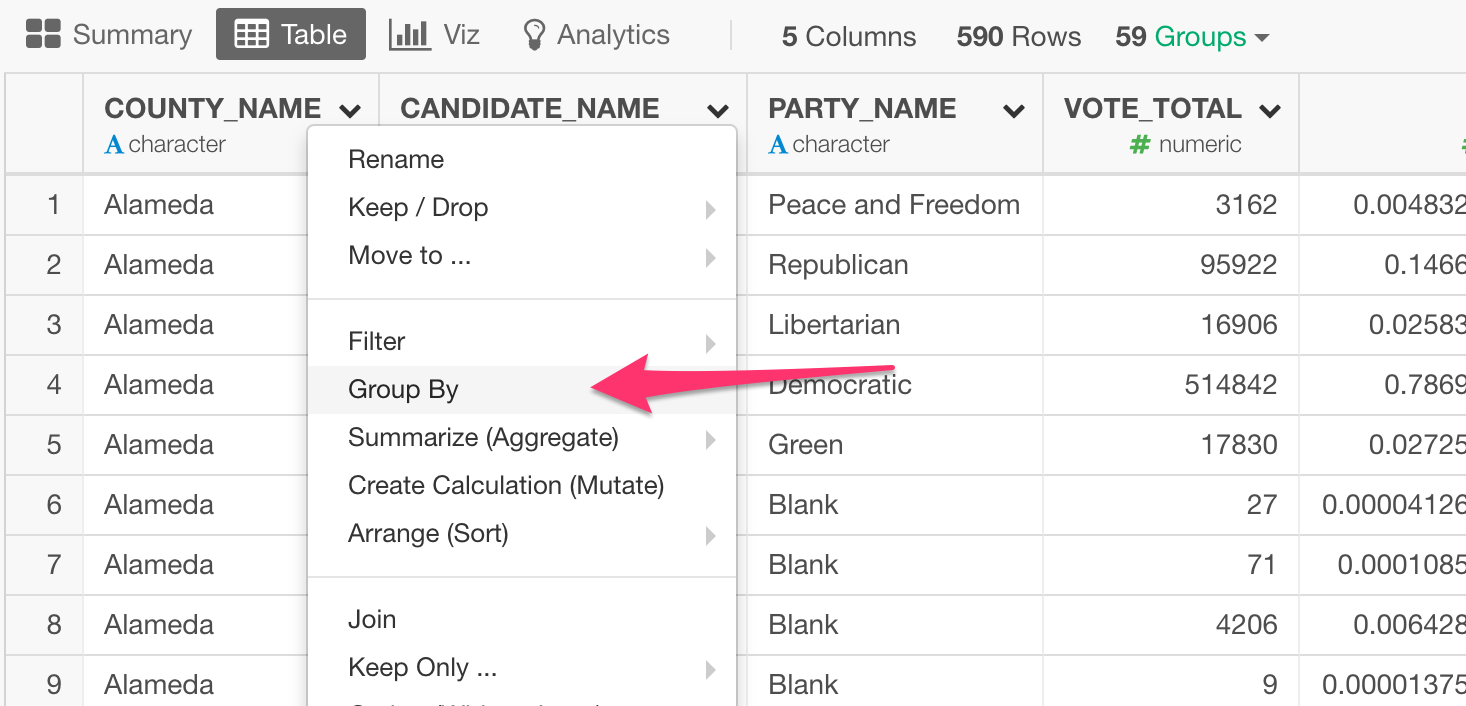
With your situation, what you have done would work. But you might want to consider using Group By and Summarize. You can first use Group By to group the data frame by Session ID, for example.
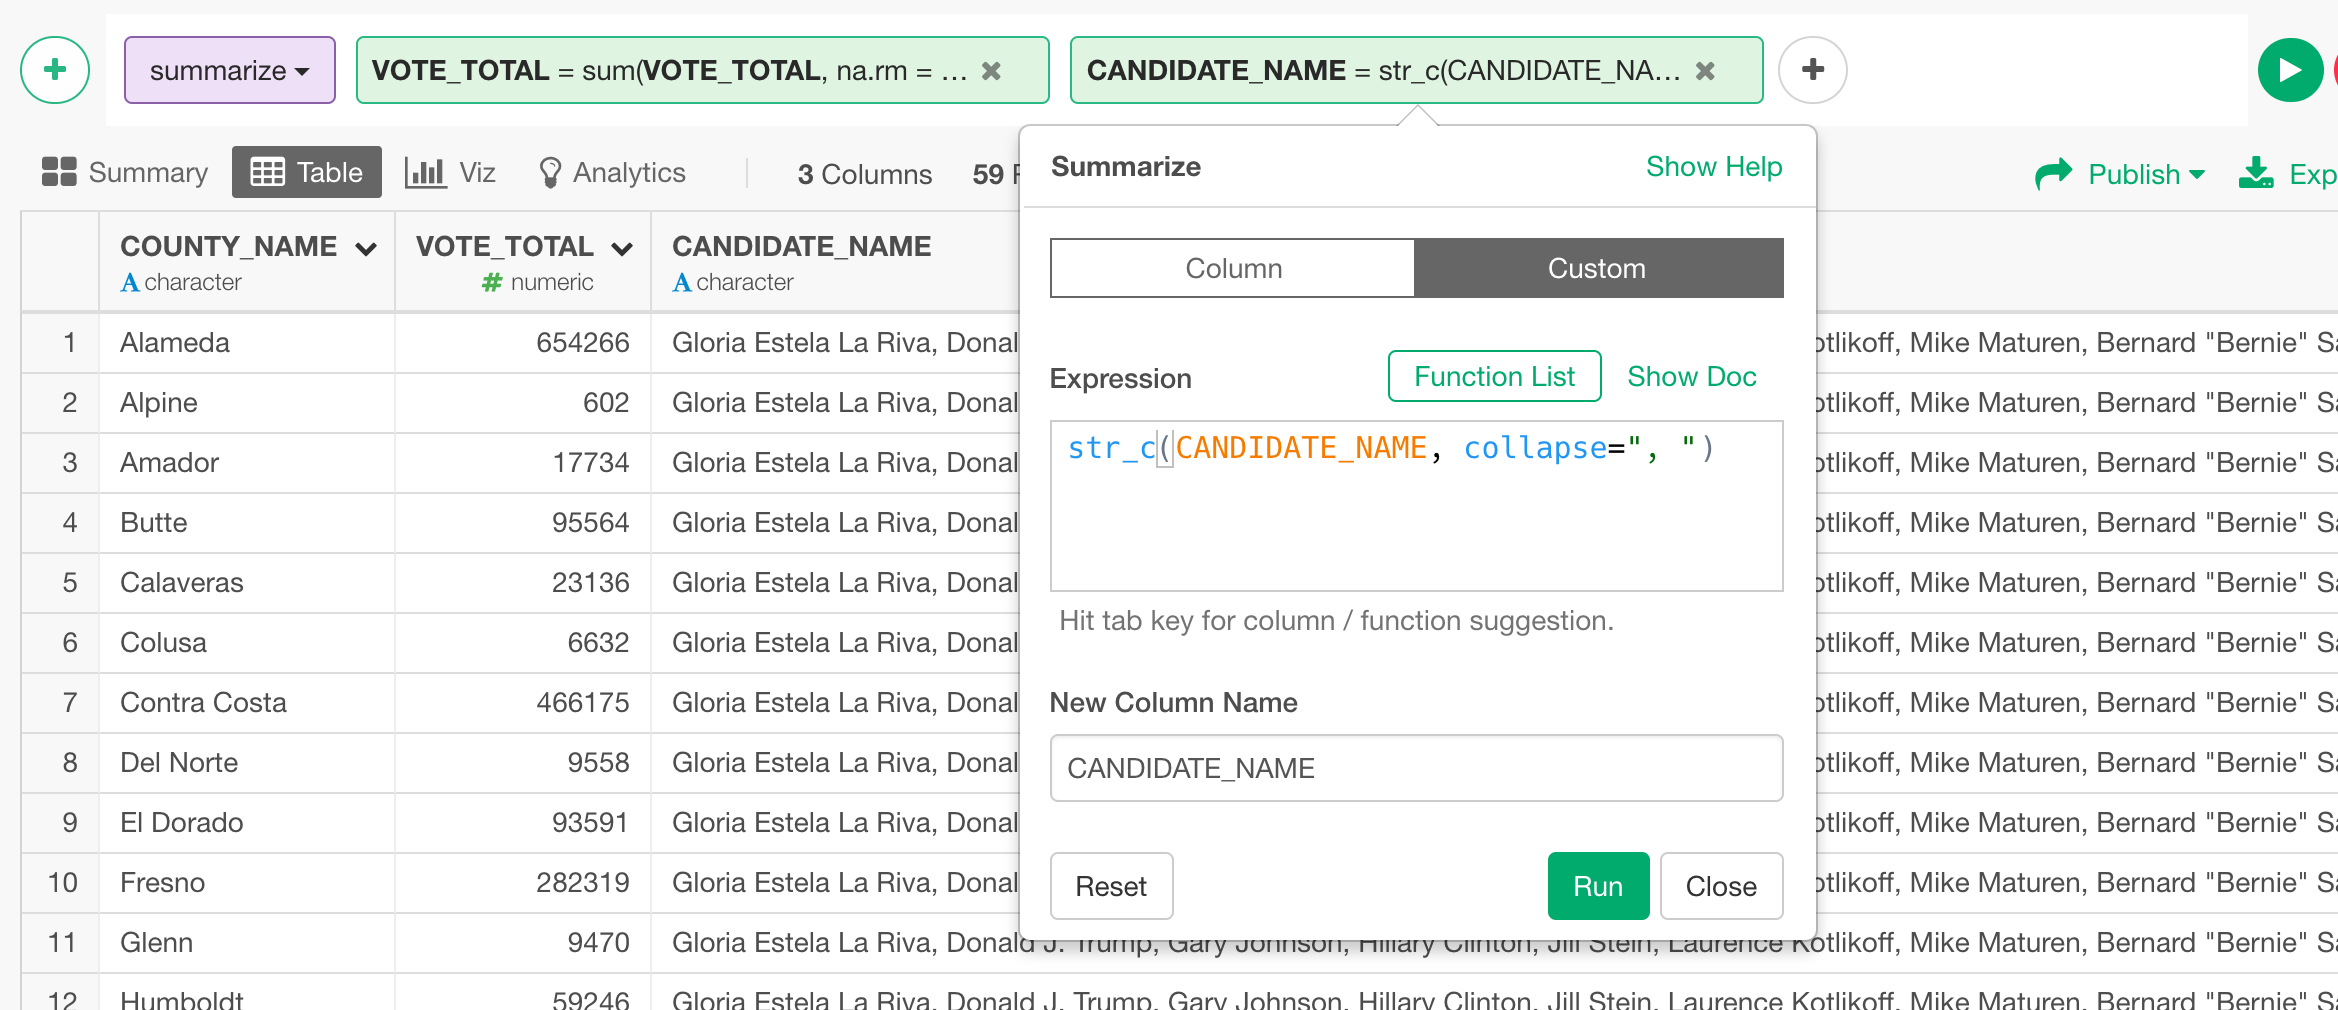
Then, you use Summarize with something like below.
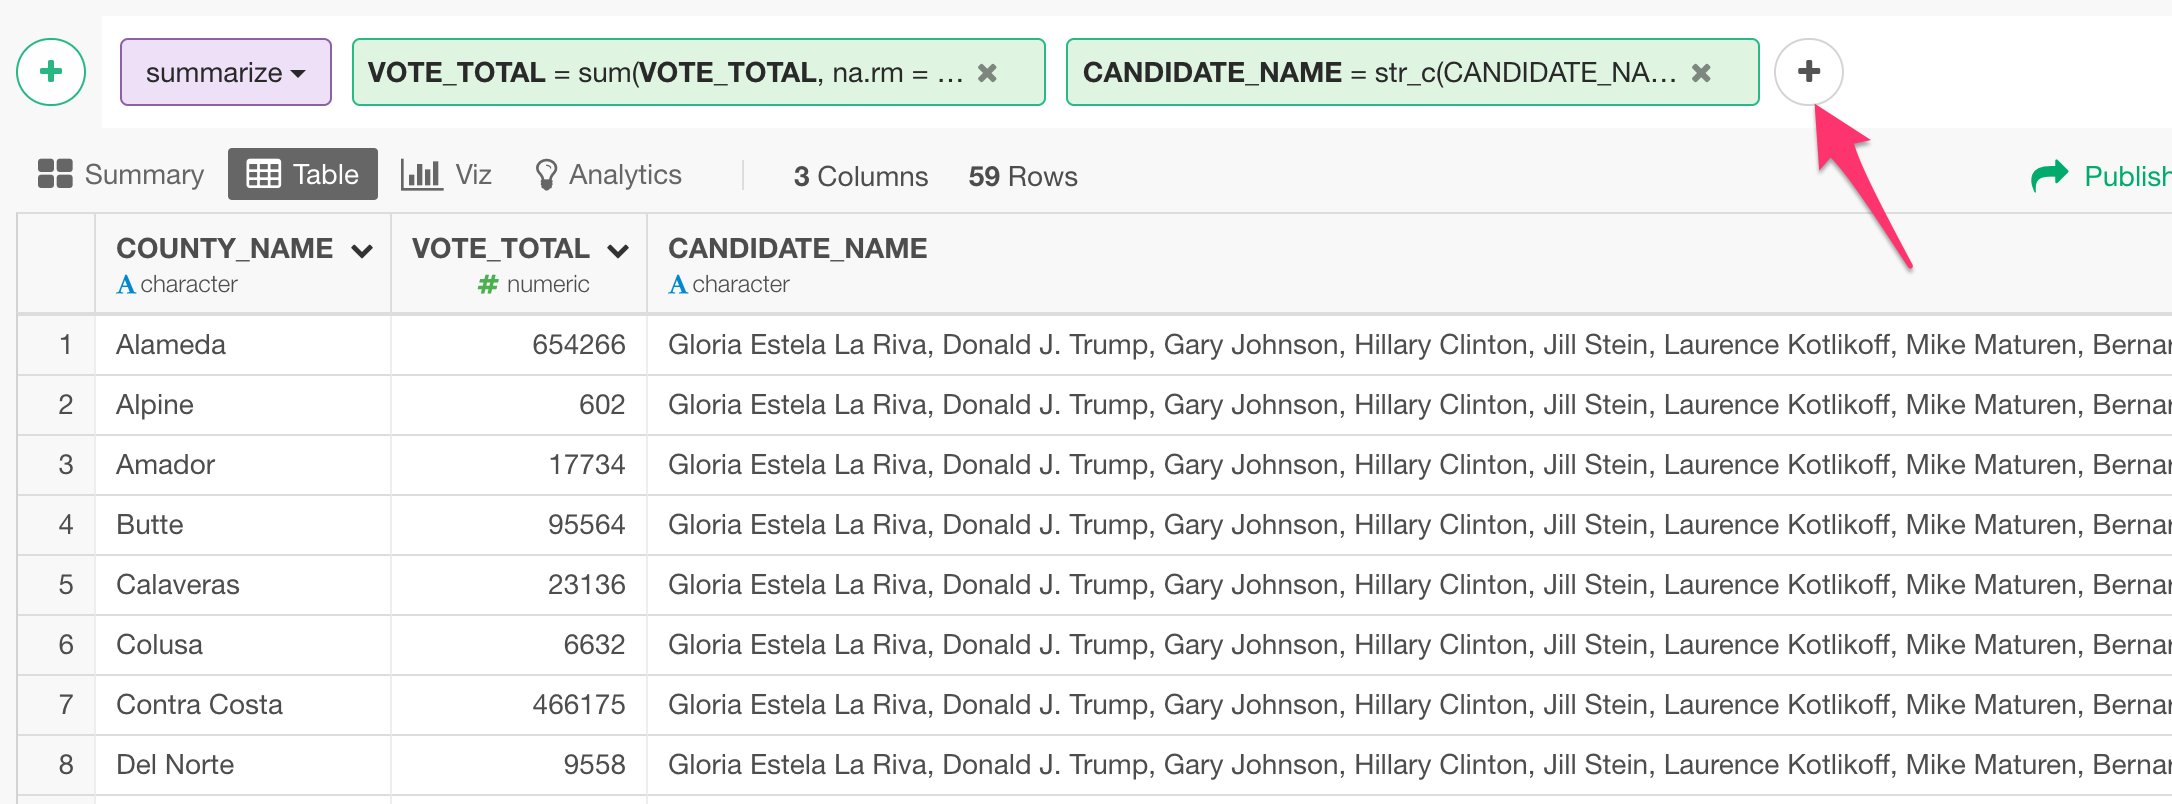
You can click on ‘Plus’ button to add multiple calculations in the same Summarize step.
This way, you can have one row for each session ID with the concatenated Values.
Then, you can use Spread step to make ‘Name’ to be columns.
Let me know if you have any questions!
Cheers,
Kan
1 Like