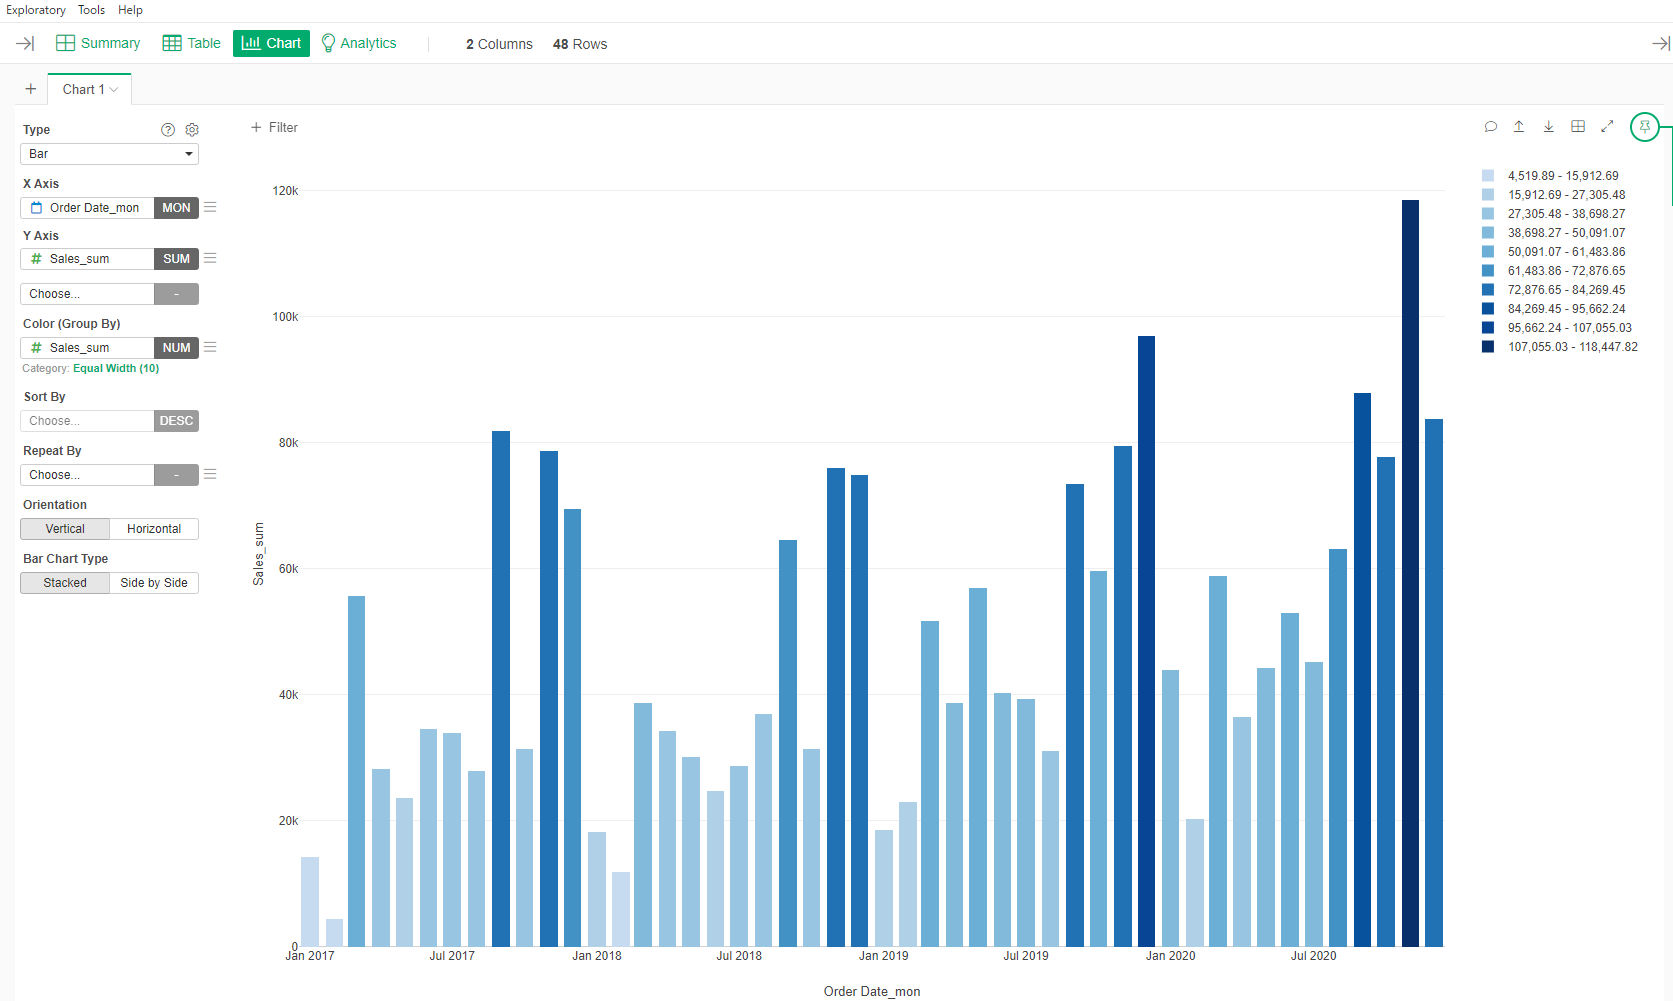
Hi - I just want to color each entire bar by the sum of sales, not sure how to do this as currently each bar is getting multiple shades of color. Thanks!

Basically, the equivalent of this code:
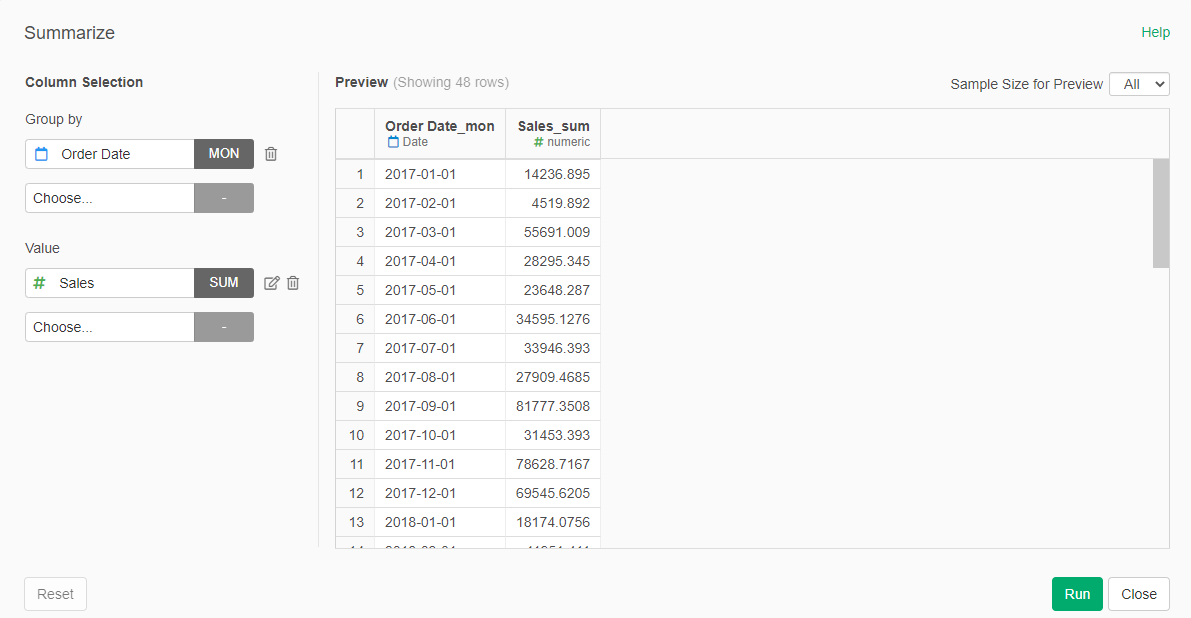
store %>%
  group_by(yearmo = floor_date(order_date,'month')) %>%
  summarise(sum_sales = sum(sales)) %>%
  ggplot(aes(yearmo,sum_sales,fill=sum_sales))+
  geom_col()+
  scale_fill_distiller(palette = 'Blues',direction=1)