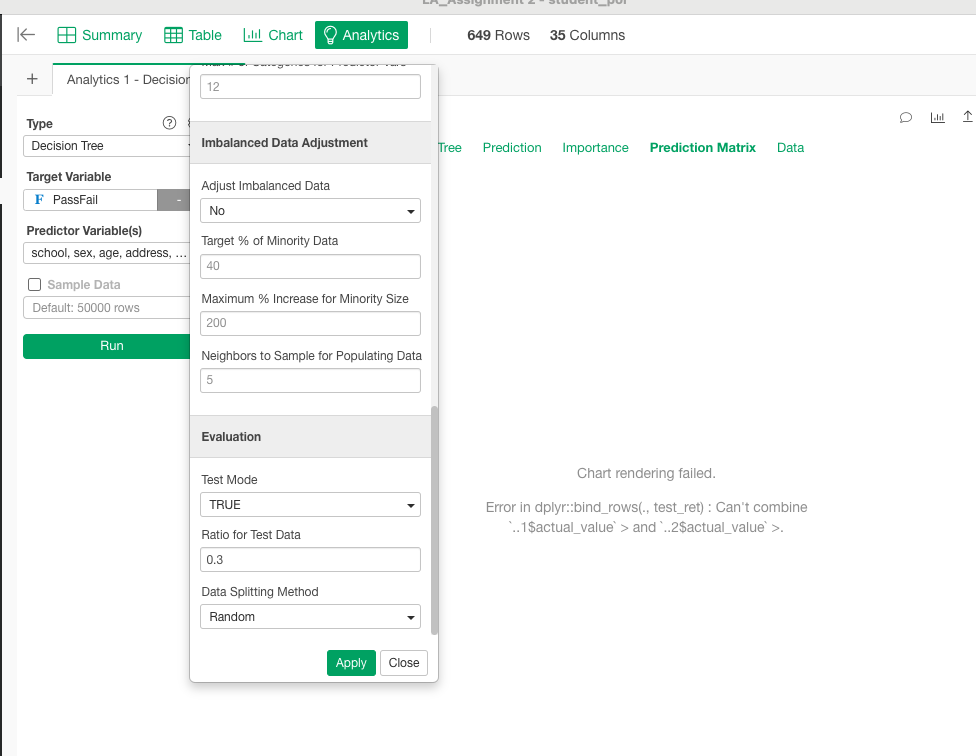
I’m trying to check the prediction matrix for my decision tree (test mode on, with a test set ratio of 0.3) for a research project but kept getting an error saying, ‘Chart rendering failed.’ I didn’t have this problem before when running Decision Tree. Not sure what happened here. I’ve tried reinstalling R packages but no luck.
Most likely, you have upgraded the underlying R packages like dplyr.
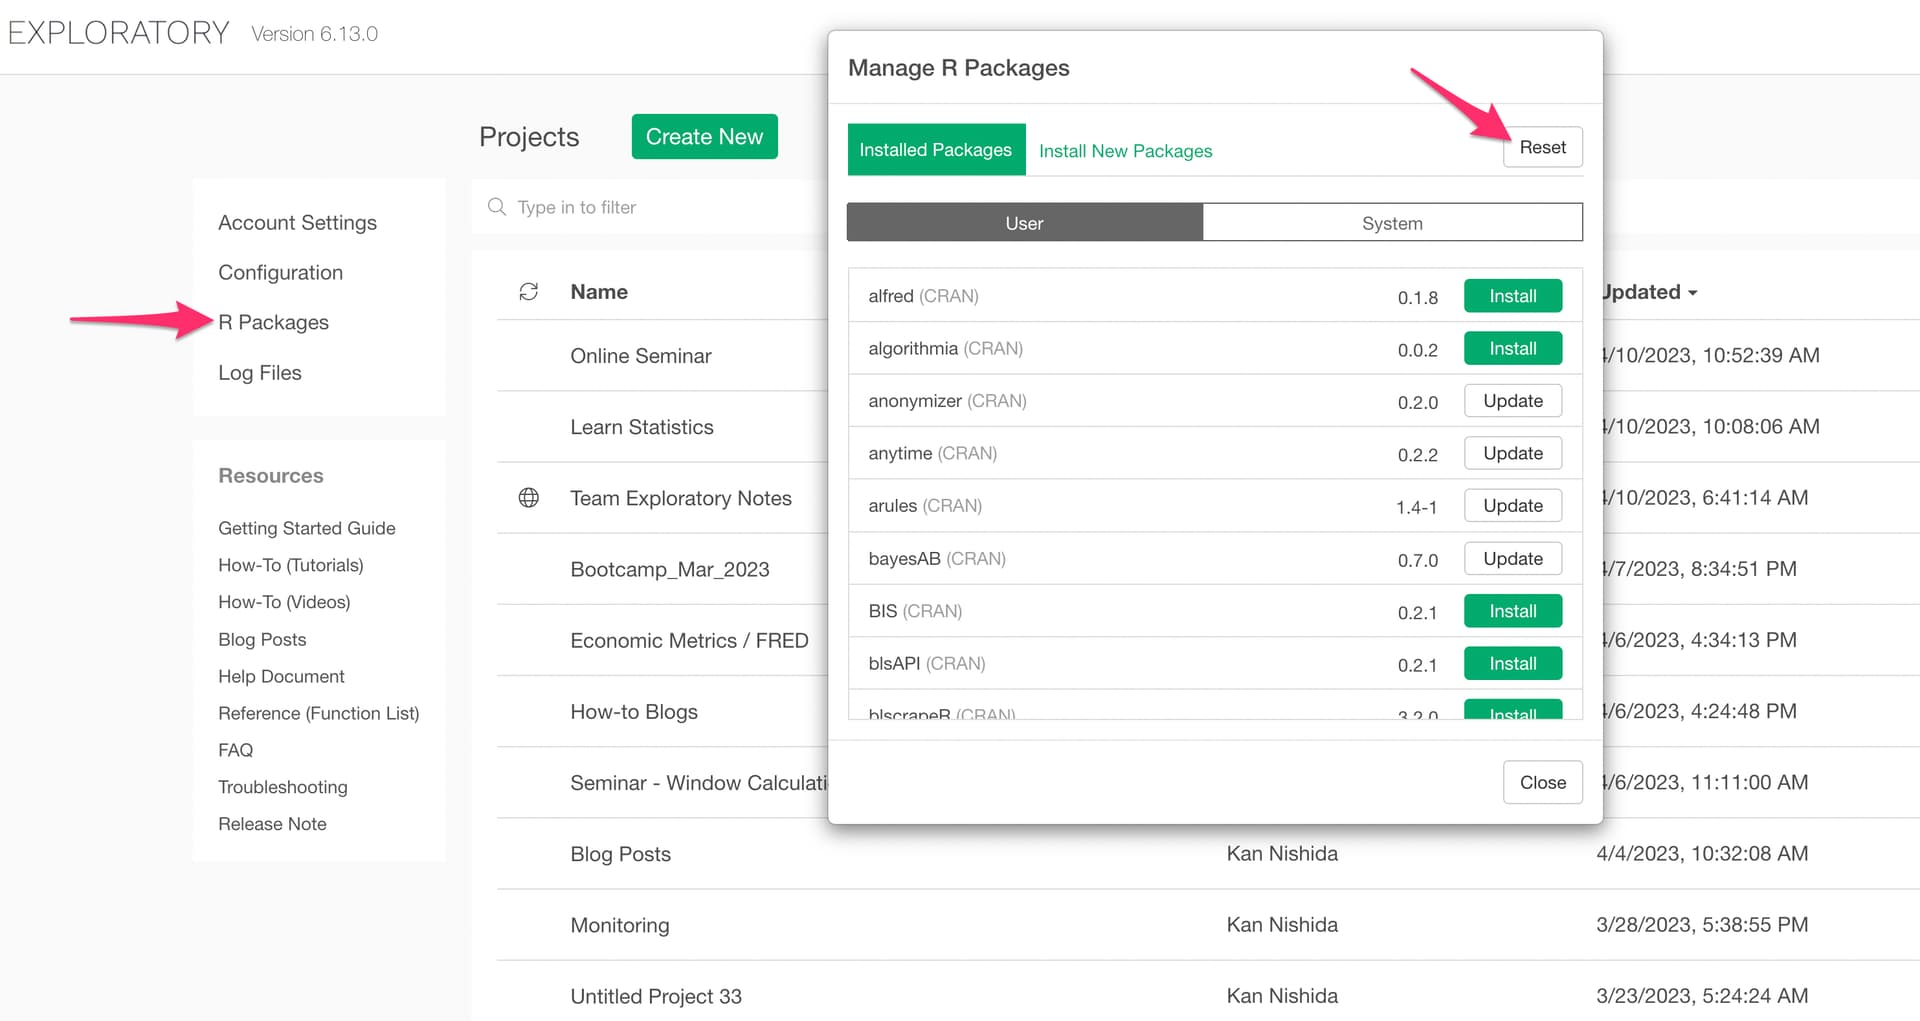
You can reset it from the R Package management inside Exploratory.
Thank you for the quick response, Kan. I’ve reset the R packages a few times but still got the same rendering error.
Thank you for the data. I tested your project, but it works ok for me here.
What is the version of Exploratory are you using? Can u check from here?
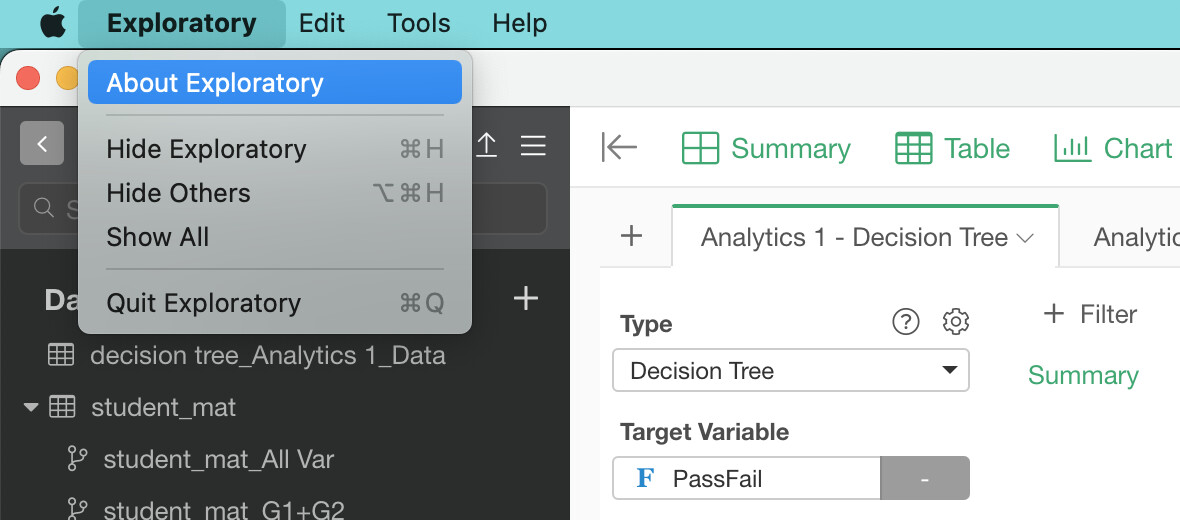
Thank you for checking. My version is Version 6.12.2.1_MAC_ARM (Production).
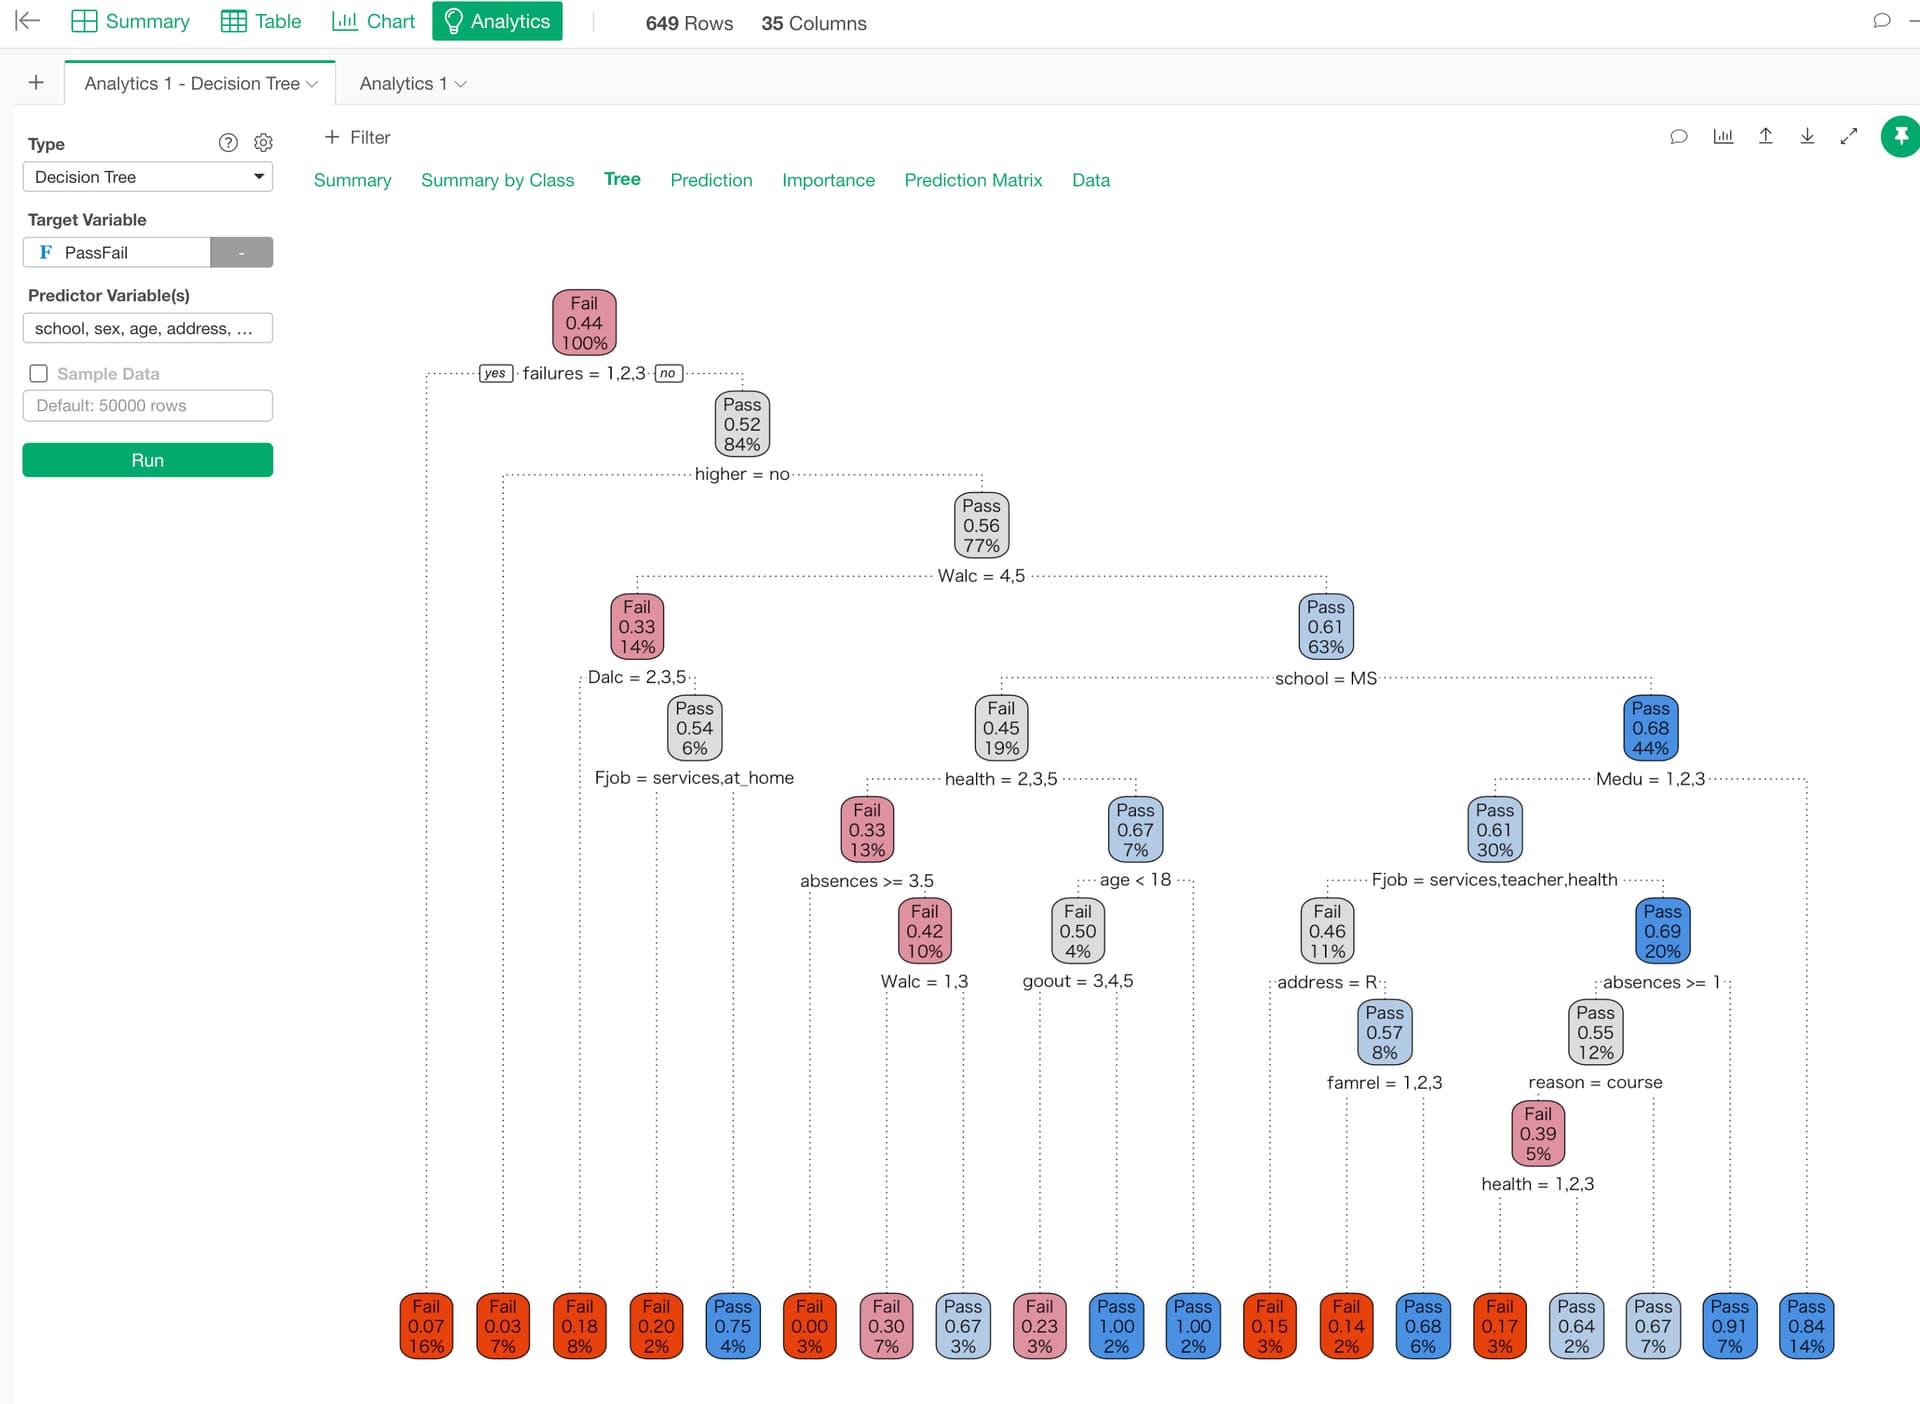
Please note that I also don’t have issues with generating the tree diagram. Only the ‘Prediction Matrix’ is not rendering correctly.
Sorry, I can reproduce the error with the Prediction Matrix tab!
We’re looking into it now, will get back to you shortly!