Autocorrelation in ARIMA time series models

I’m doing time series analysis and the autocorrelations in the data are important for me to understand. I can see the autocorrelations and the lags in the ACF tab of the ARIMA results, but I’d like to know which of the Autocorrelations from the model are significant

  • is it possible to plot significance of autocorrelations in Exploratory?
  • after running the ARIMA the ACF data are shown after the time series is made stationary, correct?
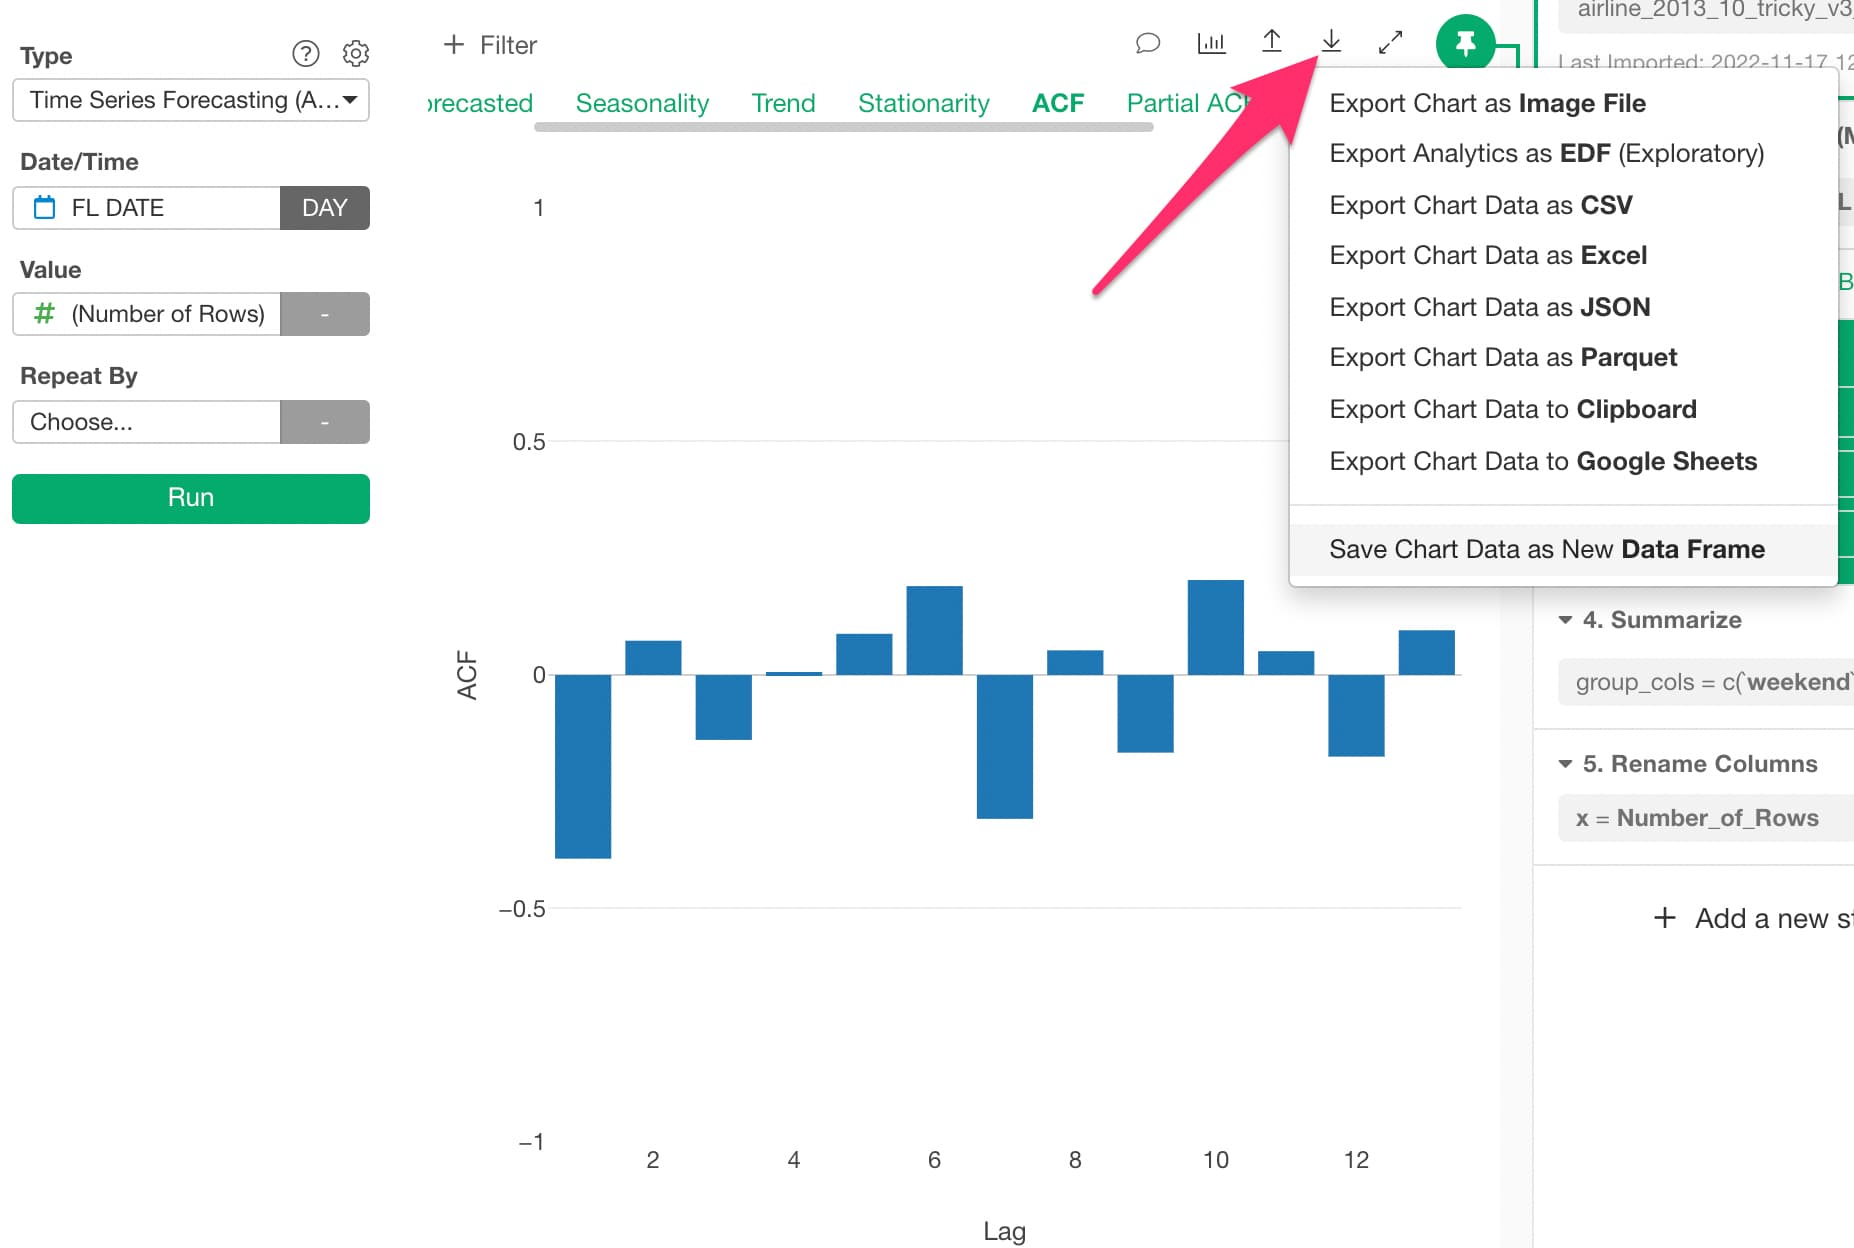
  • is there a way to download the autocorrelation data from the ARIMA plot?

Thanks!

Hi Rob!

  • Displaying the significance of autocorrelation is not supported as of now.
  • Yes. The displayed ACF is based on the data after differentials to make it stationary.
  • The ACF data can be exported from the analytics view chart in various ways that are available in the menu on the downward arrow icon as in the screenshot below.

Hi, Hideaki - I should have realized that to download the ACF data in ‘Analytics’ is the same as with ‘Charts’. Thanks for your clear explanation for all! I do think a confidence interval for the ACF and PACF plots would be useful.