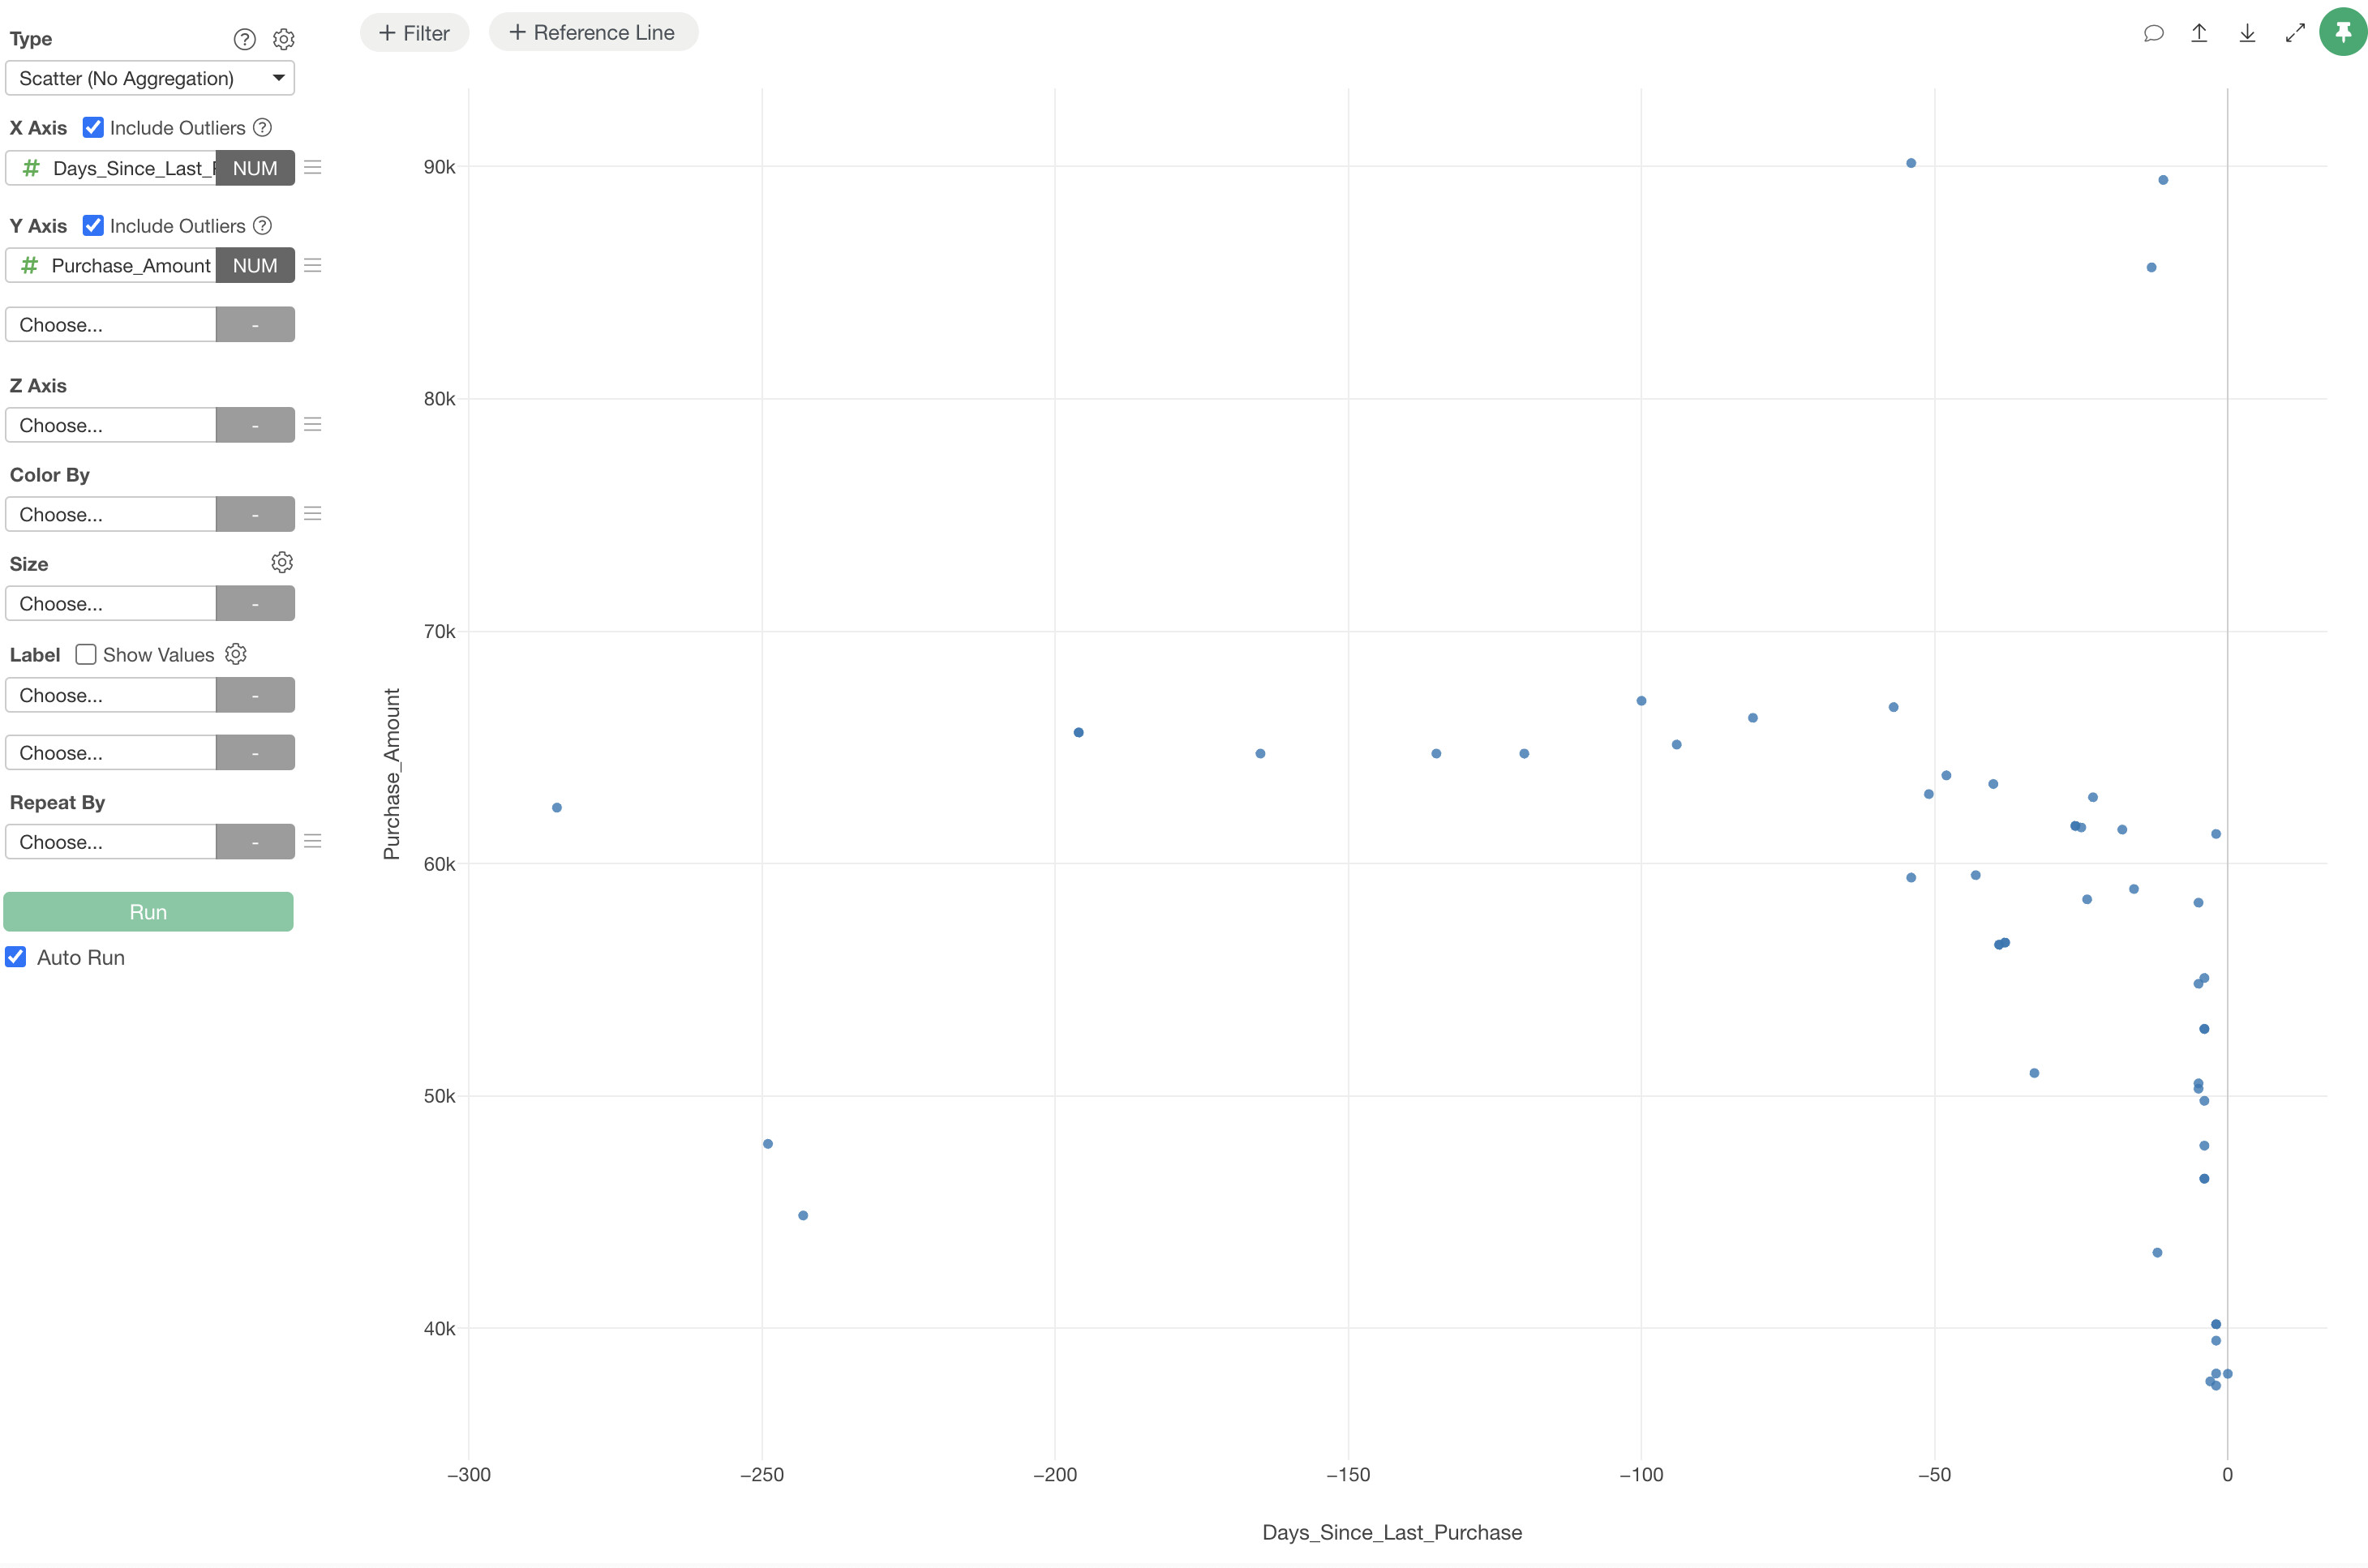
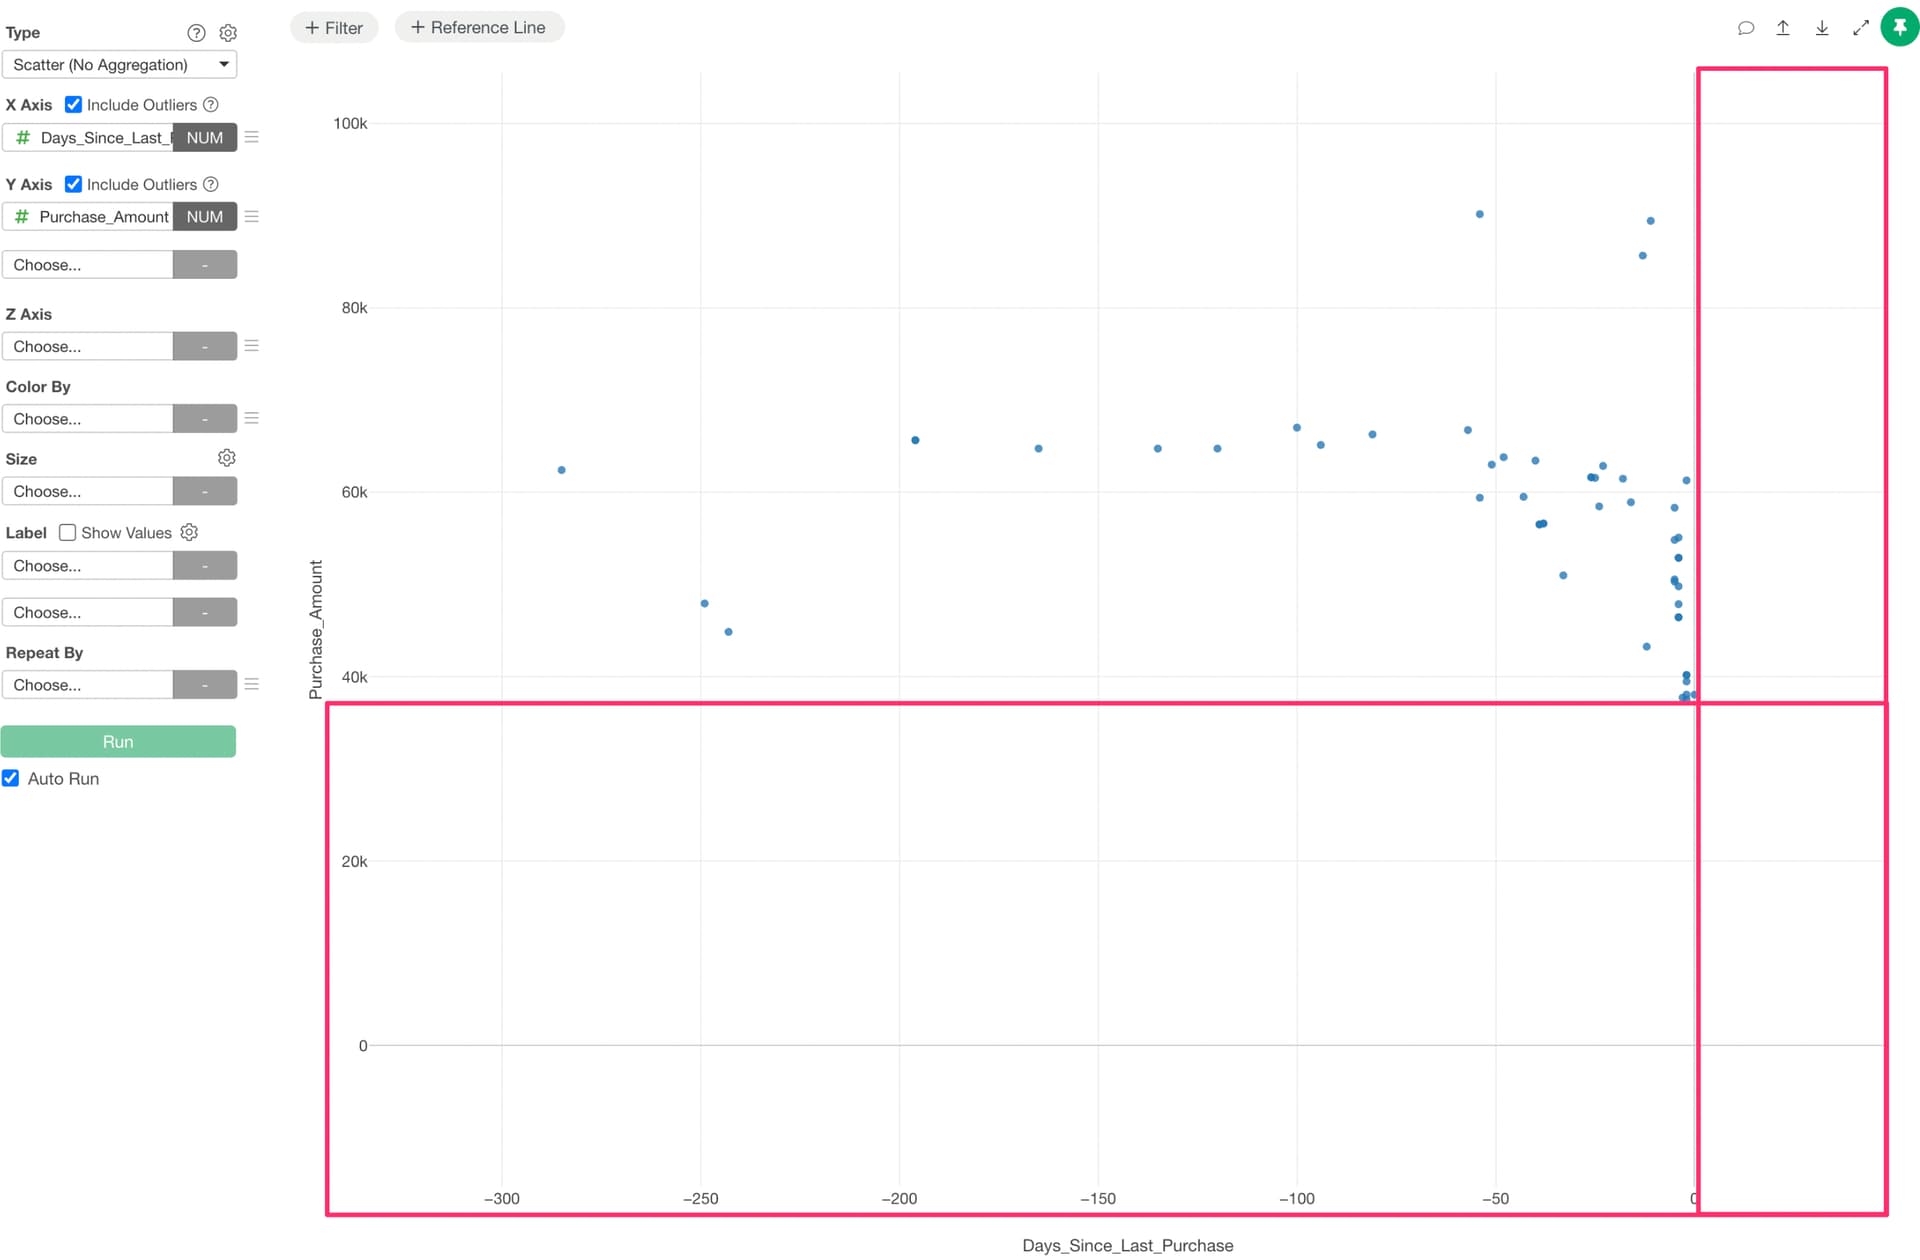
When visualizing data with a scatter plot, you may encounter situations where excessive whitespace appears as shown below. This can be adjusted through the settings.
The whitespace is likely caused by the “Include 0 in X-axis (Y-axis)” setting being checked. Note that by default, this option is unchecked.
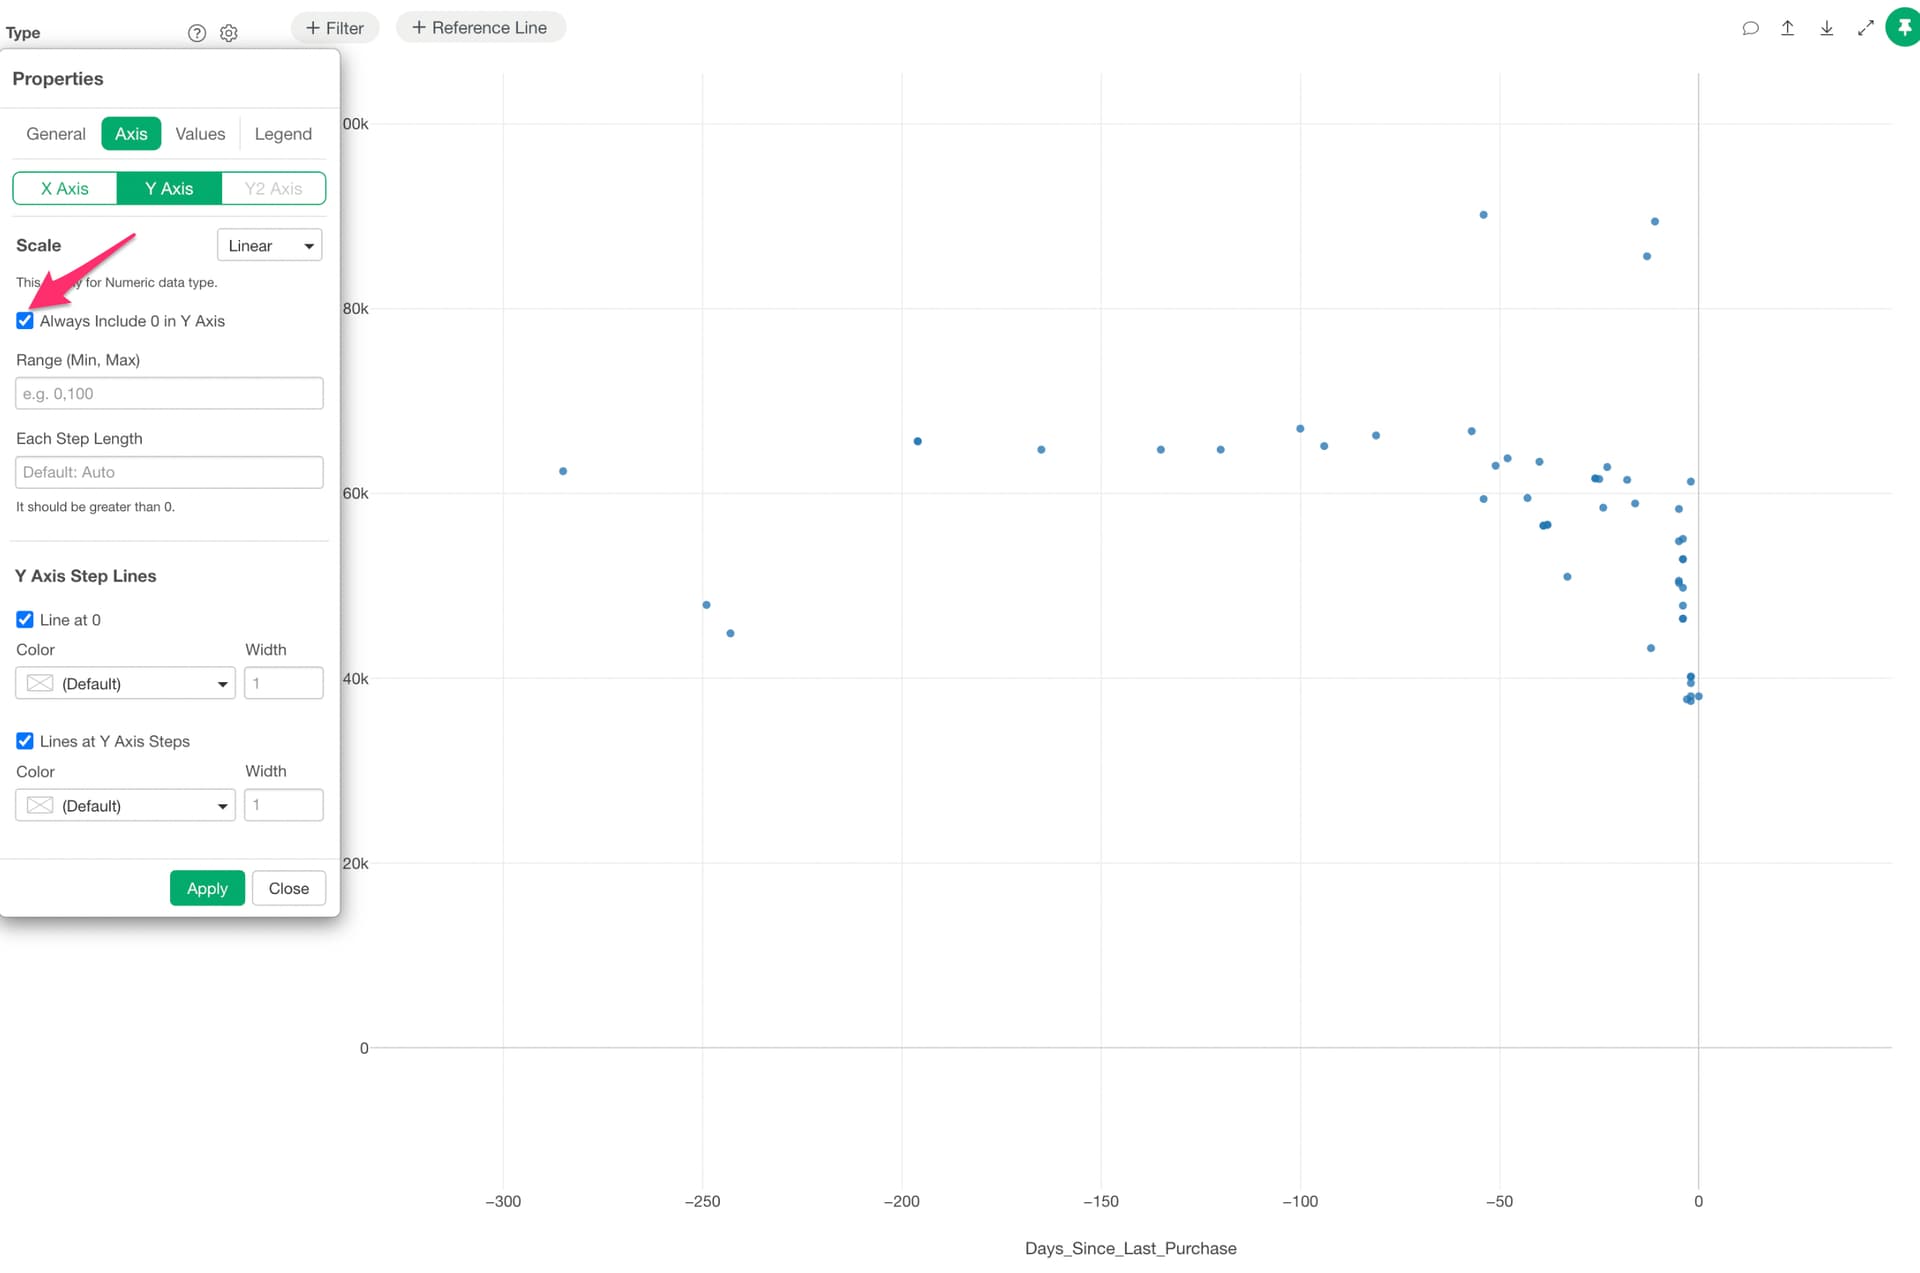
By unchecking the “Include 0 in X-axis (Y-axis)” setting, the scatter plot display will adjust to fit the area where data points are shown.